Production Interactive Projects
Lake Level Viewer is a web-based tool that creates visuals capturing lake level changes that range from six feet above to six feet below historical long-term average water levels in the Great Lakes. Potential shoreline and coastal impacts are also provided. This information can be used to determine appropriate preparations, including zoning restrictions, infrastructure improvements, and habitat conservation.
Download the papers (1, 2) about Lake Level Viewer.
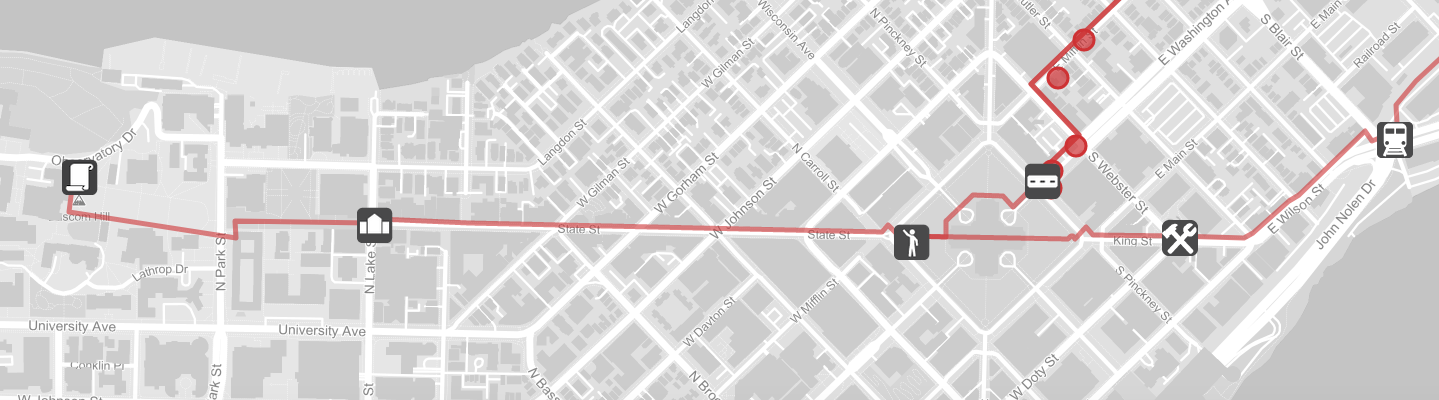
Madison's East Isthmus: Paths to Change mobile learning module was created for the Introduction to International Studies (IS101) course at the University of Wisconsin-Madison by Spring 2014 Mobile Cartography Seminar participants Brian Davidson, Julia Janicki, Vanessa Knoppe-Wetzel, Fei Ma, Rashauna Mead, Chelsea Nestel, Caroline Rose, Carl Sack, and Guiming Zhang under the direction of Professor Robert Roth, with the cooperation of International Studies Professor Stephen Young and Teaching Assistant Mario Bruzzone. Narration was written and performed by Stephen Young. Updates were performed 2014-2015 by Carl Sack; current version is 1.1. All site content is licensed Creative Commons 3.0 unless otherwise noted below. Questions or suggestions about the project should be directed to Stephen Young (sjyoung3@wisc.edu) and Robert Roth (reroth@wisc.edu).
Download the paper about Global Madison.
See the source code at the Github Repo.
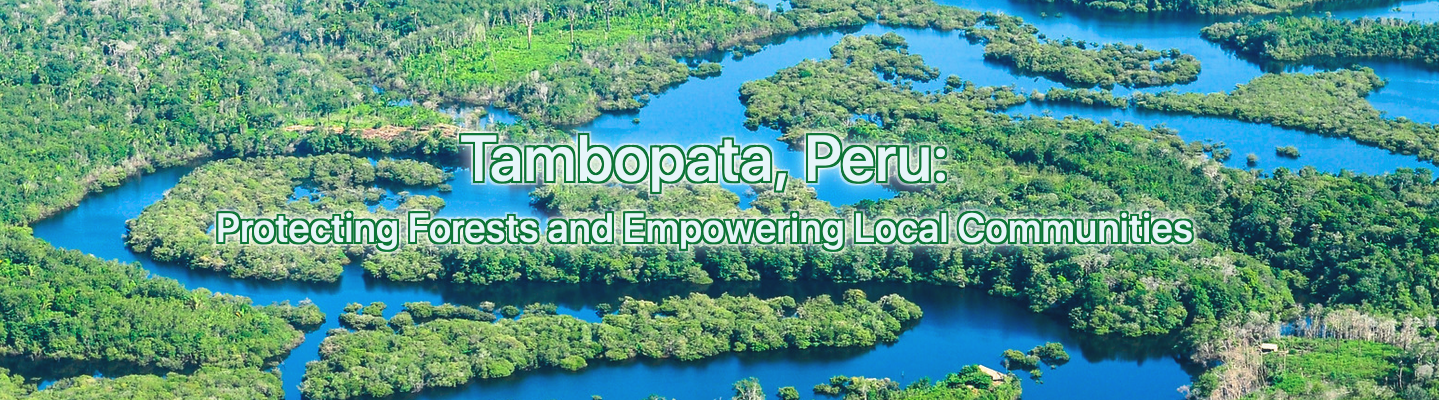
Tambopata: Who Owns Paradise?, is a map-centric, multimedia website created to enrich an educational role playing exercise about biodiversity, conservation, and development in the Amazon. The exercise assigns students a character from the Tambopata region of the Peruvian Amazon, and asks them to evaluate four proposed zoning plans from their assigned perspective. Using principles of web cartography, we designed the four proposal maps to communicate complex information and allow for increased exploration. Compared to the previously used static maps, the website increases opportunities for student engagement with the material, incorporates multimedia, and clarifies spatial relationships and land use patterns. The website is available publicly and can be integrated freely into other university and high school courses.
Download the paper about Tambopata.
See the source code at the Github Repo.
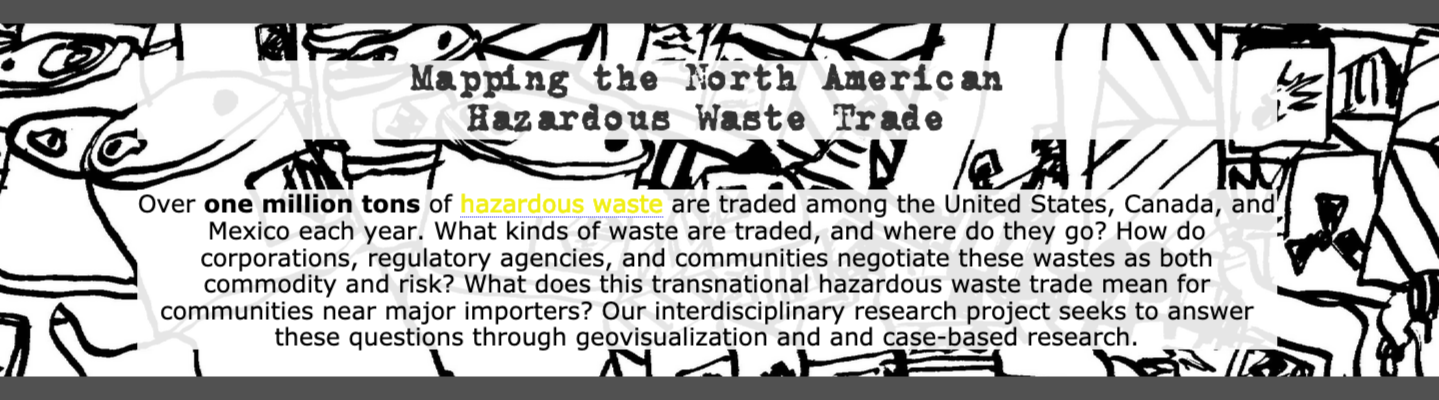
Over one million tons of hazardous waste are traded among the United States, Canada, and Mexico each year. What kinds of waste are traded, and where do they go? How do corporations, regulatory agencies, and communities negotiate these wastes as both commodity and risk? What does this transnational hazardous waste trade mean for communities near major importers? Our interdisciplinary research project seeks to answer these questions through geovisualization and case-based research.
Read more about the HazMatMapping tool here.
The Coastal Erosion Visualization Suite is a map based visualization tool used to calculate various erosion scenarios on the Lake Michigan shoreline in Central Wisconsin.
View the full site.
Flyover Country is a National Science Foundation funded offline mobile app for geoscience outreach and data discovery. The app exposes interactive geologic maps from Macrostrat.org, fossil localities from Neotomadb.org and Paleobiodb.org, core sample localities from LacCore.org, Wikipedia articles, offline base maps, and the user’s current GPS determined location, altitude, speed, and heading. The app analyzes a given flight path and caches relevant map data and points of interest (POI), and displays these data during the flight, without in flight wifi. By downloading only the data relevant to a particular flightpath, cache sizes remain reasonable, allowing for a robust experience without an internet connection.
See the source code at the Github Repo.
A series of examples designed to show different methods of panning and zooming in an interactive map. These examples are used in Geography 575: Interactive Cartogrpahy and Geovisualization.
View the full site.