Before any inference can be performed, the needed environmental data layers must be ready and properly referenced in the project file. The collection of these references to environmental data layers constitutes the GIS database. The GIS database:
| • | provides data on the environmental variables used in the soil inference; and |
| • | defines the spatial extent of the resulting soil maps. |
If the data layer for an environmental variable is not referenced or does not exist, the variable will not be used in the inference.
When loading environmental data layers, the layers must be in the same coordinate system.
The native file format for SoLIM Solutions is 3dr format. However, SoLIM Solutions can convert other commonly-used raster file format (e.g. TIFF, ERDAS IMAGE) to .3dr format on the fly. SoLIM Solutions can also rasterize commonly-used vector file format (e.g Shapefile) into 3dr format. See File Converters in the Utilities menu for how.
SoLIM Solutions automatically checks the spatial extents and resolutions of the data layers when they are loaded. If the spatial extents of the data layers do not match, SoLIM Solutions only perform soil inference over the common area covered by all data layers. Now data layers with different resolutions can be used together in SoLIM Solutions.
This section provides an instruction to the GIS database management in SoLIM Solutions. With the functionalities provided by the program, you can construct, display and explore the environmental datasets of your study area. GIS database management consists of the following tools:
The "GIS Database" Node in the Project Panel
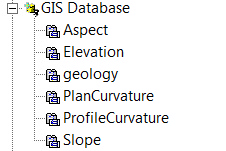
By manipulating this node and its sub-nodes, you can add and delete environmental data layers in the GIS database.
The GIS Database Views:
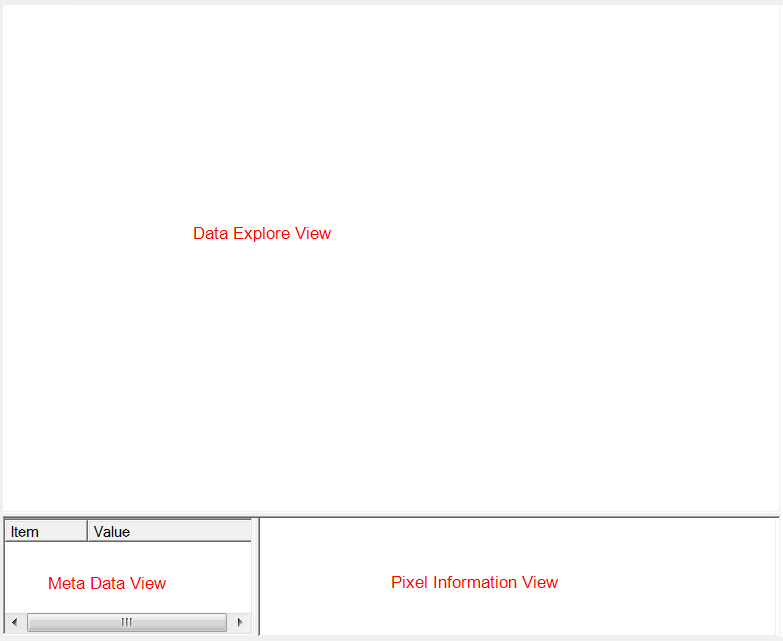
The GIS database view contains three sub-views:
The Data Explore View: provides a graphical view of the data layer currently selected.
The Pixel Information View: displays the value of pixels at or near the mouse pointer.
The Meta Data View: displays the header information (meta data) of the data layer currently selected.
The View Control Toolbars
![]()
The toolbar provides view control functionalities, such as zooming and panning for you to explore the displayed data layer .