Why Do Students Struggle in Math
Over the past few years, math has got a bad reputation among the younger generation and perhaps the same among the adults. The saying of, "I am bad at math or I am not a math person"
has somehow become a badge of honor. We not only hear “I am bad at math”, but we are also formalize and recognize it like “It's ok to be bad at math”. It’s easy and fun to say I am not a math person,
or I am bad at math, but did you think about the consequences of this among our younger crowds (high schoolers)?
In this project (website) I have analyzed, compared and presented math, science and reading scores of the high school students worldwide. Then based on my findings,
I have recommended the top 12 free resources (websites) where high school students can improve thier mathematics skills.
It's going to be a great resources page on mathematics for our high school students and their parents in the U.S.
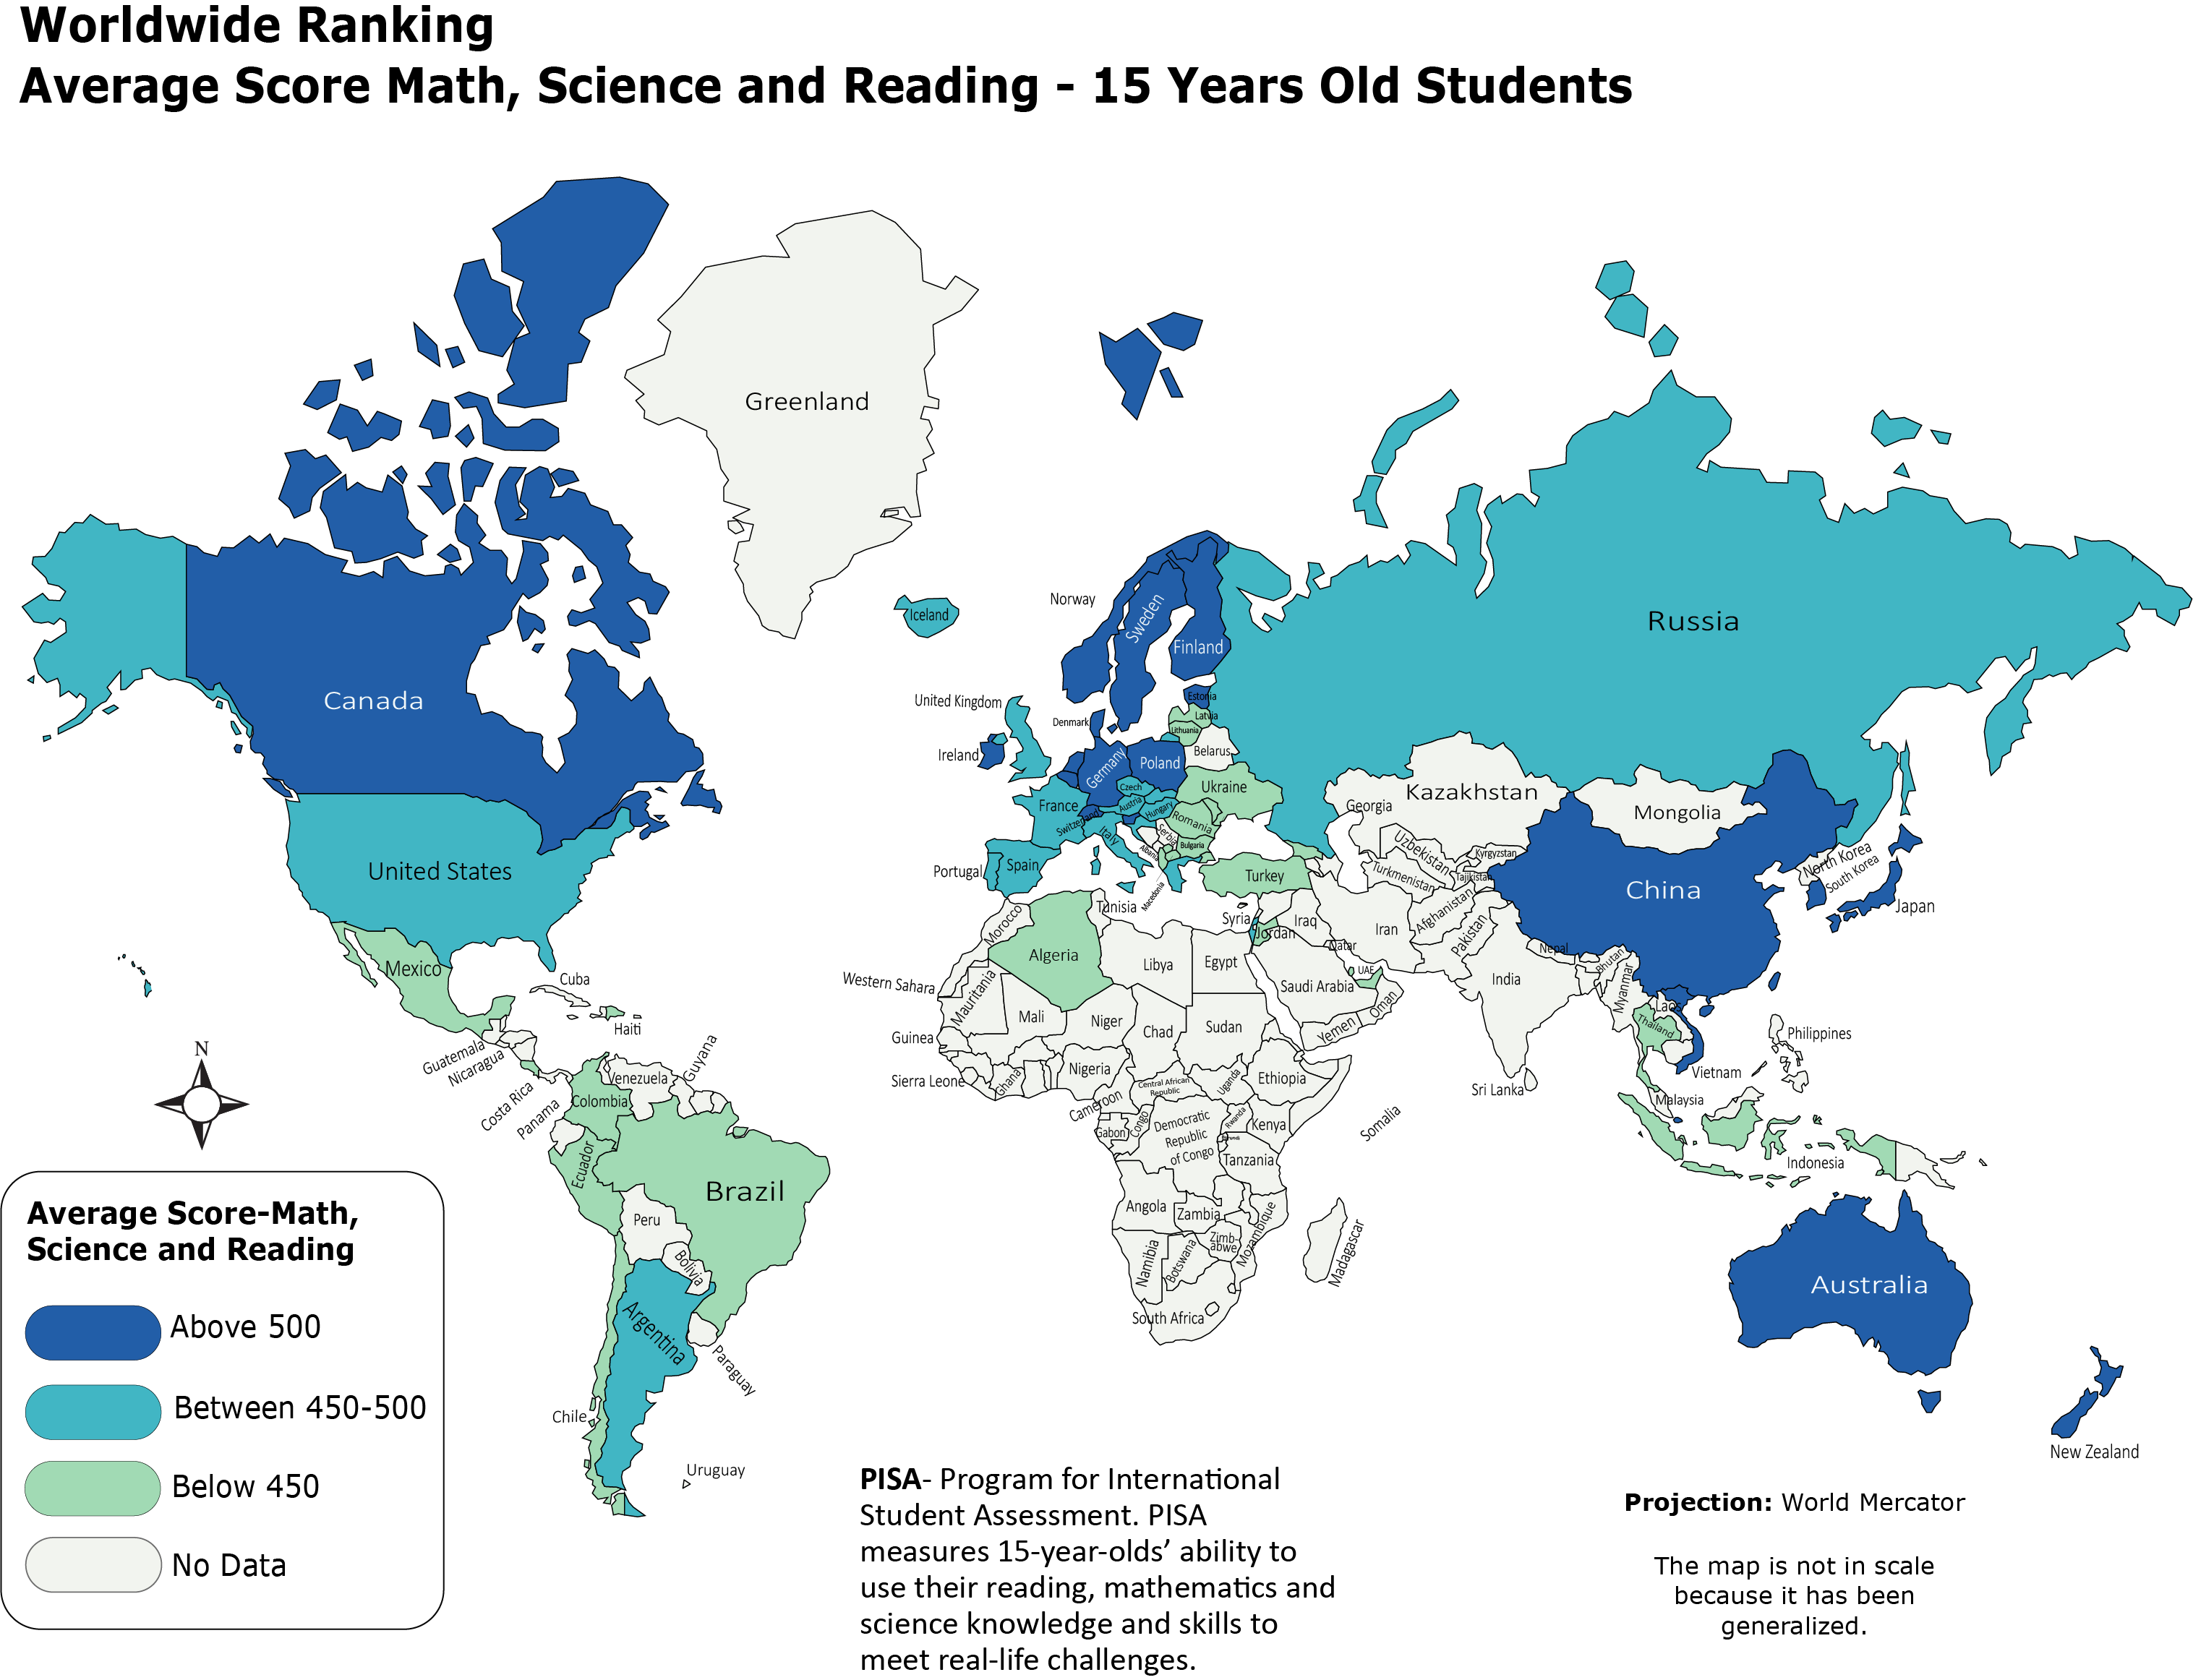
The Organization for Economic Cooperation and Development [OECD] is a global policy organization that includes the United States and about half of Western Europe countries.
It administers international comparison tests, called Programme for International Student Assessment (PISA), for 15 year-old students in Mathematics and other subjects.
I have visualized PISA's 2015-2016 report in the map below.
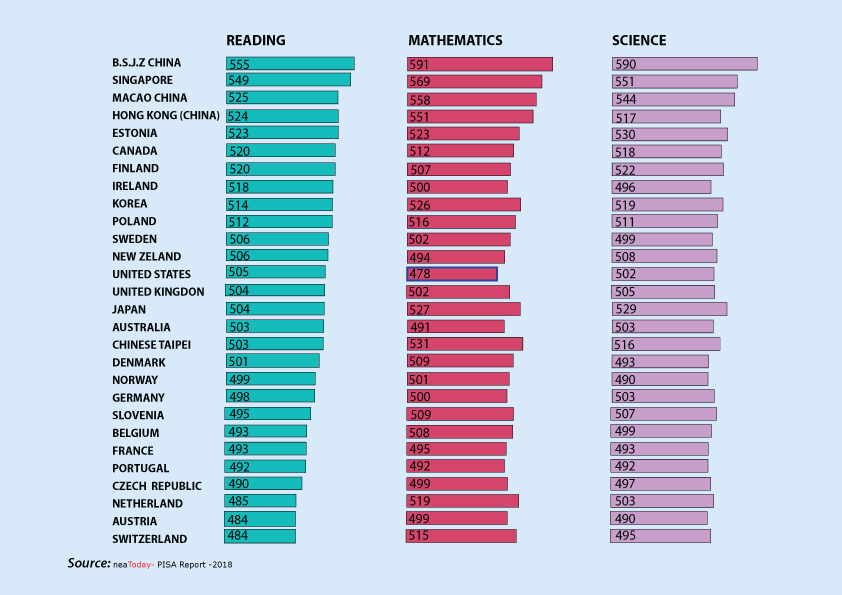
According to PISA-2018 report, U.S students scored slightly better in all three areas (Reading, Math and Science) compared to the previous report. While statistcally insignificant as a measure of imrovement, according to neaToday "the increase was enough to push the United States slightly above the OECD average in reading and science, while still falling below in math. Their scores were similar to those of students in Australia, Germany, New Zealand, Sweden and the United Kingdom in at least two of these three subjects." For more details see the figure below.
Why U.S High/Middle School Students Scored Below the Average in Math?
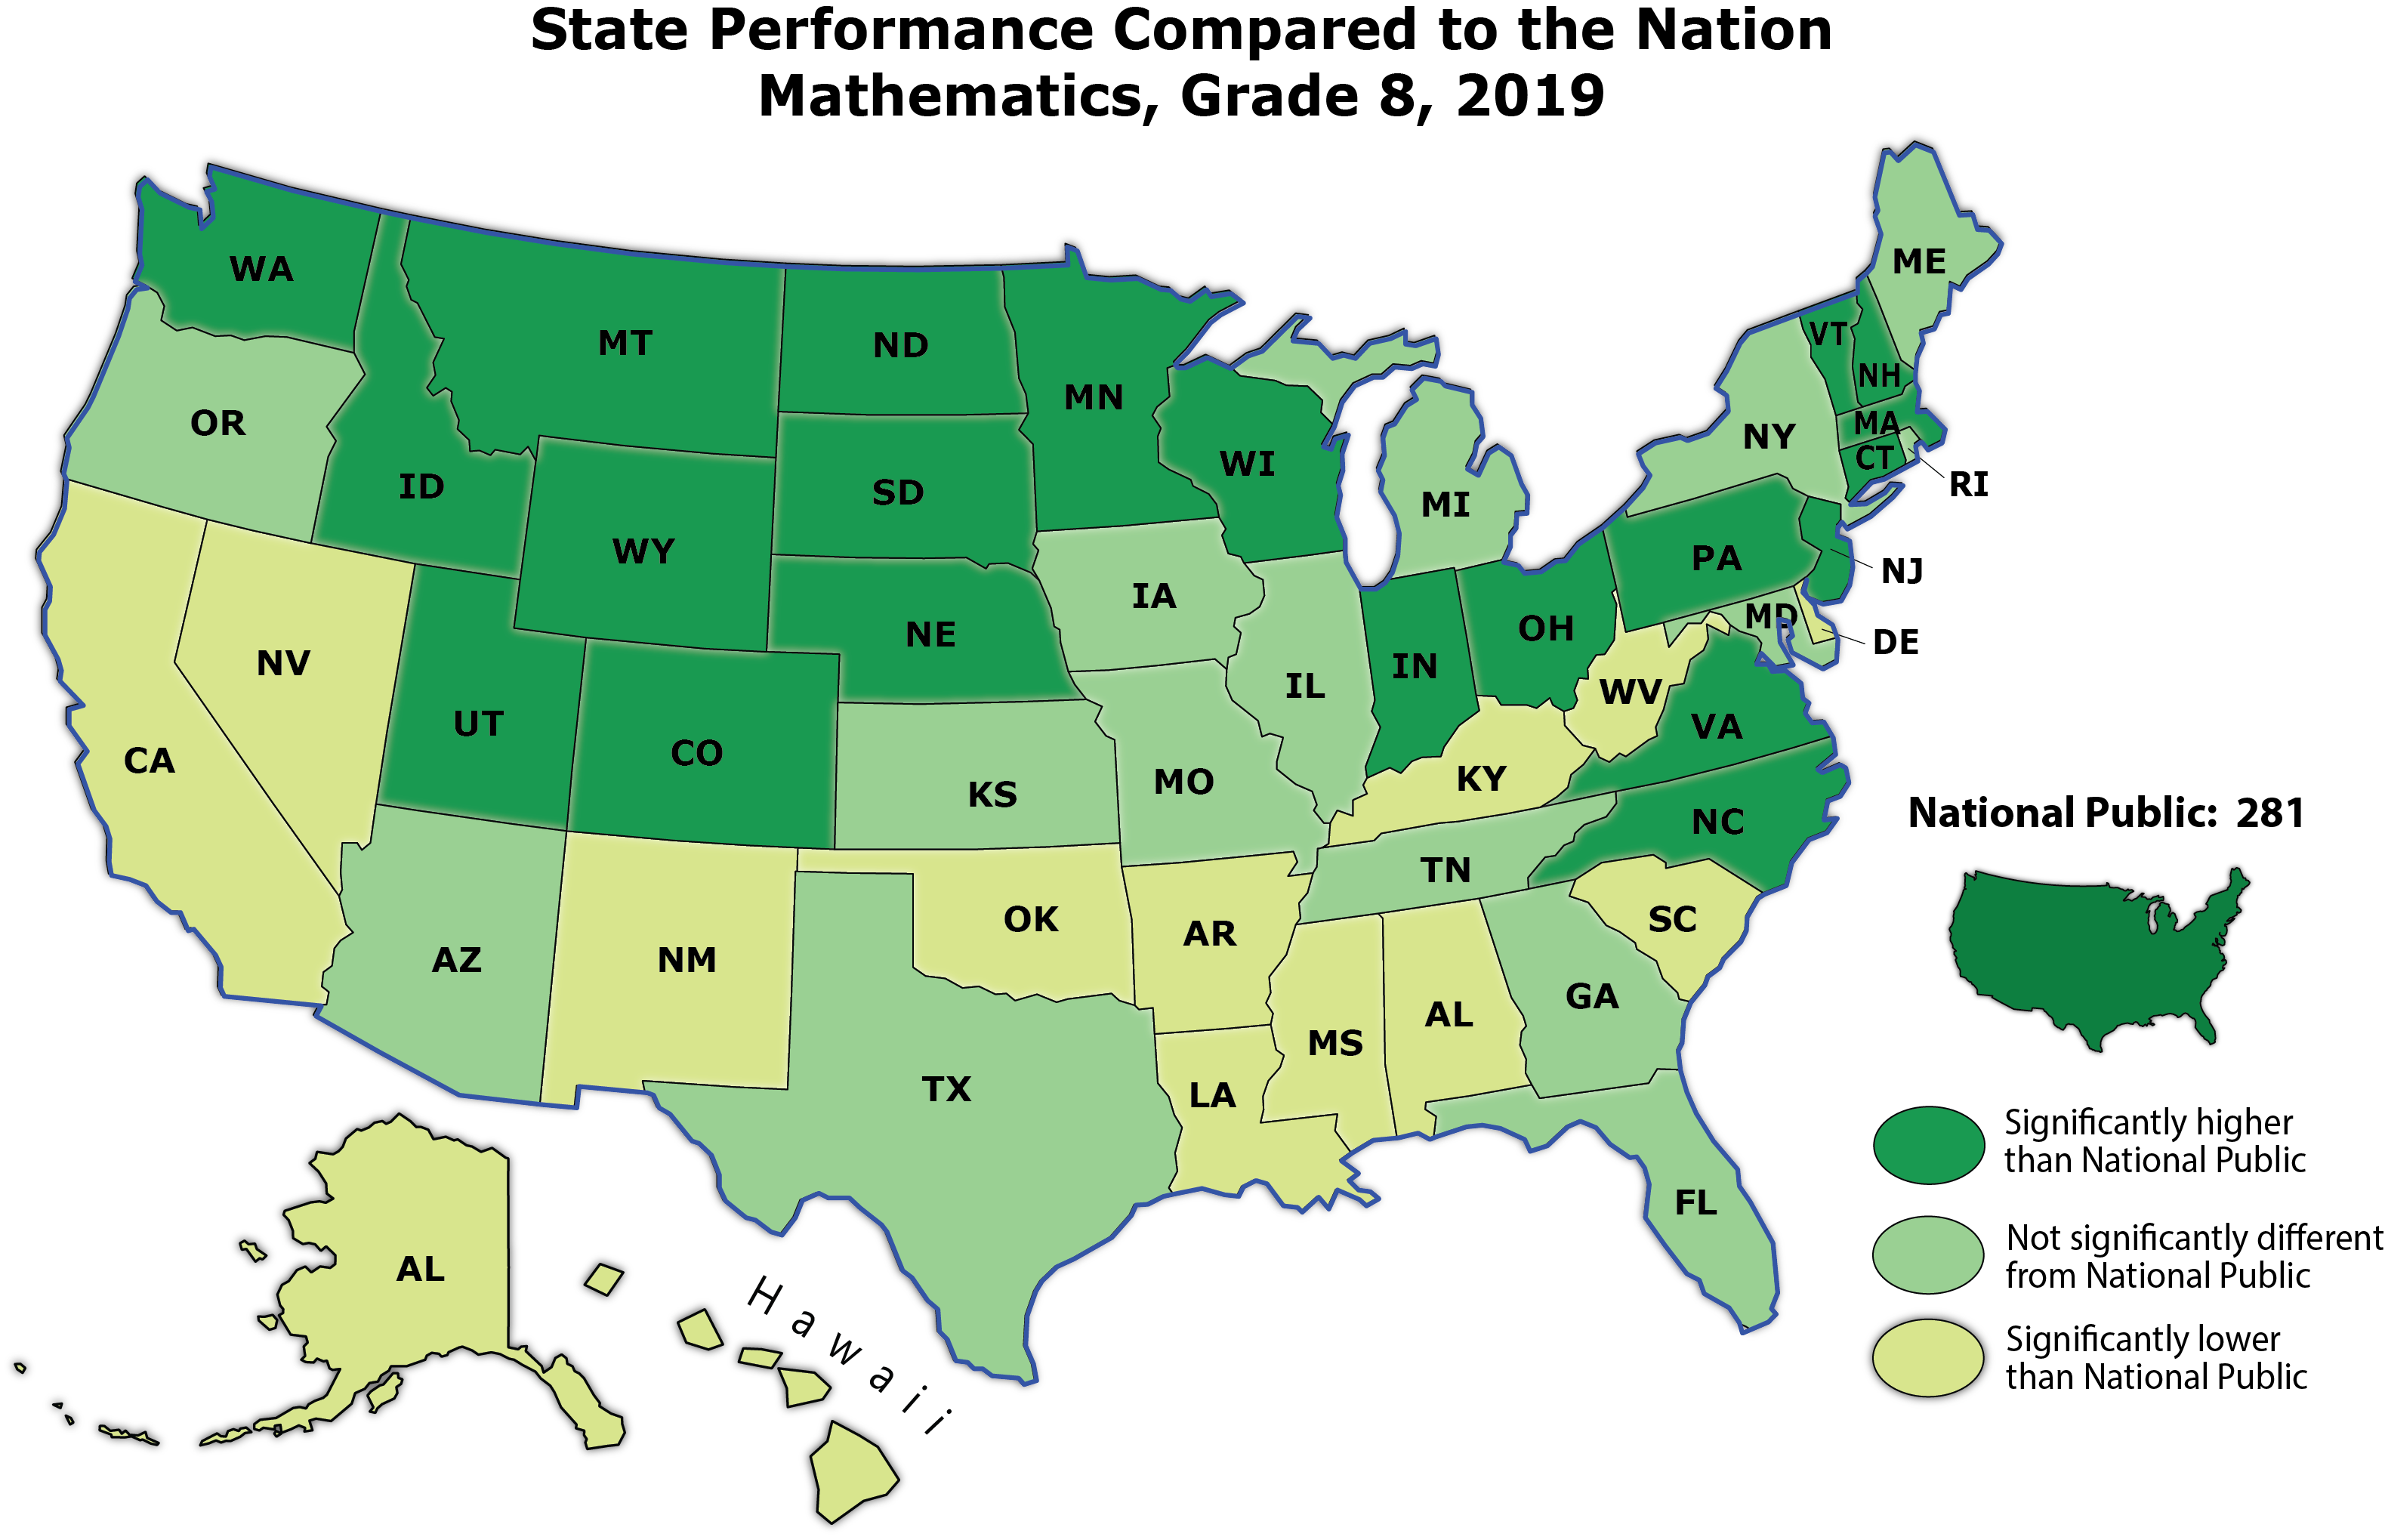
Let's have a look at the Nation's Report Card (NAEP) to compare each state performace with the national average (281).
The National Assessment of Educational Progress (NAEP) is the largest continuing and nationally representative assessment of what U.S. students know and can do in various subjects. NAEP is a congressionally mandated project administered by
the National Center for Education Statistics (NCES), within the Institute of Education Sciences (IES) of the U.S. Department of Education. Source: Wikipedia.
The thematic map above tells us that 21 out of 50 States performed significantly above the national public (281), while there isn’t a significant difference from the national public for 14 of them, and 15 out of 50 performed significantly lower than the national public.
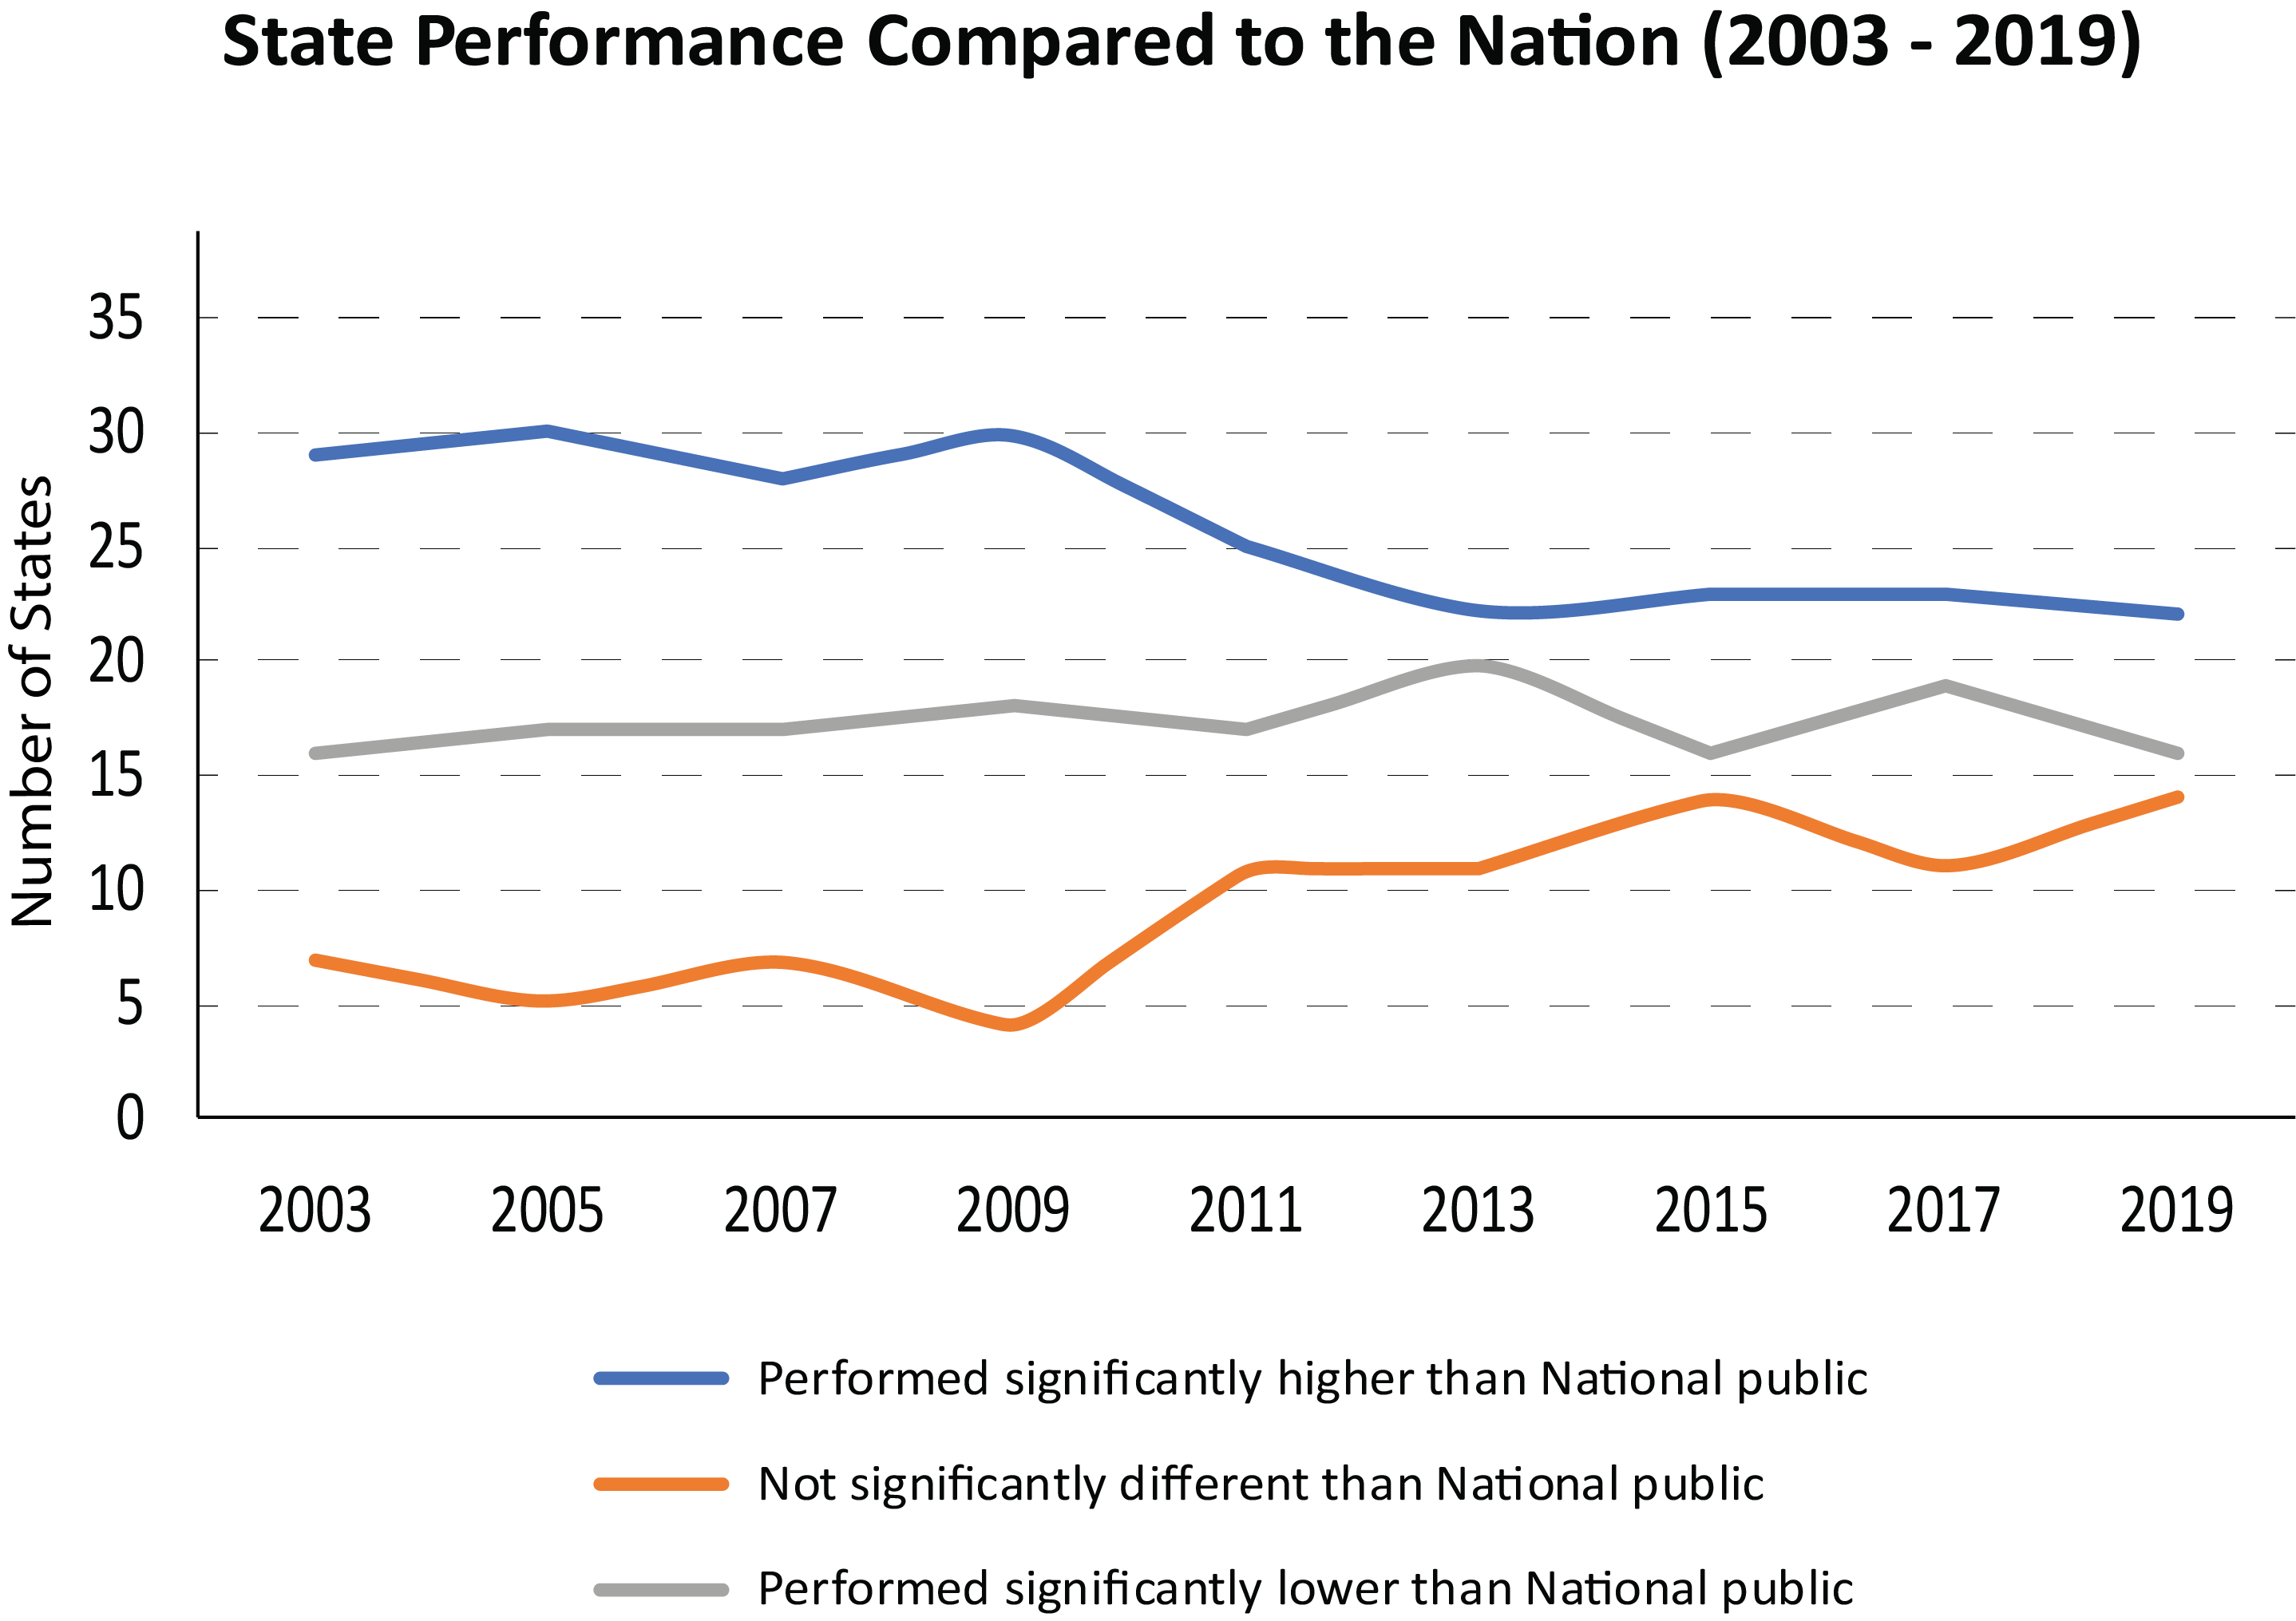
If we compare the 2019 mathematics performance with 2013, it looks like the trend is negative, so there is need for more effort from both students and educators to change the trend from negative to positive. For more details see below figure or click on
State Average Scores.
Let's compare the states performance from 2003 to 2019.
Again "Performed significantly higher than National public" is decreasing and "Not significantly different than National public"
is increasing. This means our teens need more and better support to improve their mathematics skills.
