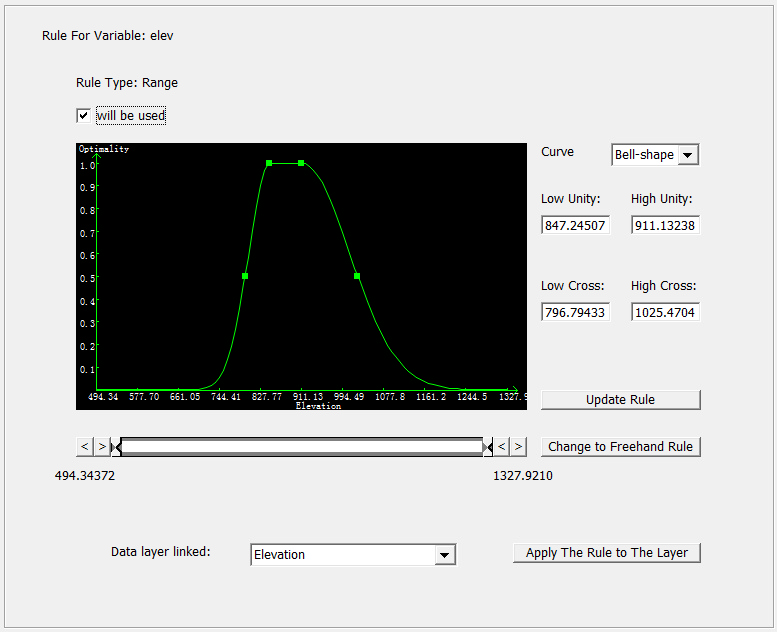
The interface for editing a range rule looks like this:
Specify Whether the Rule Is Used in the Inference
Check the box next to "will be in used" to make the rule be used in the inference. Uncheck the box to disable the rule.The rule is editable only when it is in used.
![]()
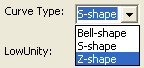
Specify Curve Type:
Select a curve type from the drop down list "Curve Type". The curve can be bell-shape, S-shape or Z-shape.
Edit the Rule
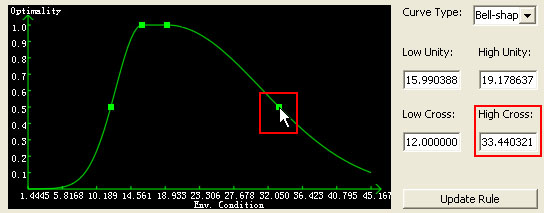
In the graphic area, the green curve is a graphic representation of the rule. There are some small square handles attached to the curve. The two square handles (A and B) on the top of the curve indicate the positions of low unity and high unity respectively; and the other two square handles (C and D) on the curve indicate the positions of low cross and high cross.
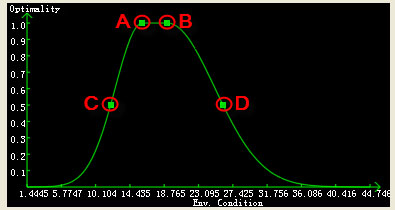
A: The location where the optimality is at unity and the environment value is low unity.
B: The location where the optimality is at unity and the environment value is high unity.
C: The location where the optimality is at half and the environment value is at low cross.
D: The location where the optimality is at half and the environment value is at high cross
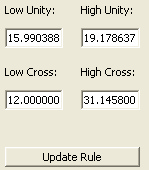
You can directly enter values for low unity, high unity, low cross, high cross in the text area to adjust the rule. Click on "Update Rule" button to submit modification. This will also change the curve displayed in graphic area accordingly.
You can also use the mouse to adjust the rule in graphic area by click-and-drag. Put the cursor close enough to any of the square handles on the green curve, click on it, hold, and drag. Dragging a handle also changes the value in the corresponding field in the text area.
Change Range Rule to Freehand Rule
Click on "Change to Freehand Rule" . Current range rule can be converted to freehand rule. You can edit the key points to edit the rule.
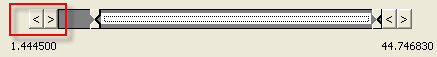
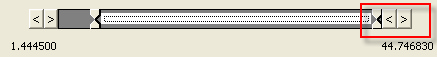
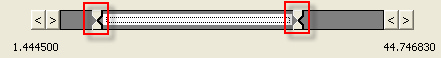
Set the Display Range of the Graphic Area
Display range decides the maximum range on the x-axis of the graph area. To set the display range, use the arrows at each end of the display range control bar.
On the left, click on "<" to decrease the low display limit, click on ">" to increase the low display limit.
 .
.
On the right, click on ">" to increase the high display limit, click on "<" to decrease the high display limit.
Current display range decides the range for the current x-axis in the graphic area. To set current displaying range,drag the handles on the display range control bar.
Select Attached Layer
If you attached a layer when creating the rule, the linked layer will be displayed.

Otherwise, the program will tell you "No data layer linked. Please set data layer".
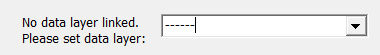
You can attach a layer at any time by using the drop-down list. You have two options here:
1) choose one existing layer to attach.
2) choose one layer which is not in the GIS database. In this case, if the selected layer file is valid and the name of the layer is not any of these of the existing layers in GIS database, SoLIM will add the layer to GIS database, and the program will also show that the layer has already been attached with current rule. If the selected layer is valid, but there is already one layer with the same name in GIS database, the program will bring up a dialog to ask if you will replace existing layer with the new one. If you click on OK, it will replace the existing layer in the GIS Database, and the program will also show that the layer has already been attached with current rule.
If the selected layer is invalid, the program will pop up an error dialog.
Tip: A rule will take part in inference only if it is attached with a layer.
Apply the Rule to The Layer
If the rule has an attached layer, you can see the effect of applying the rule to the layer.