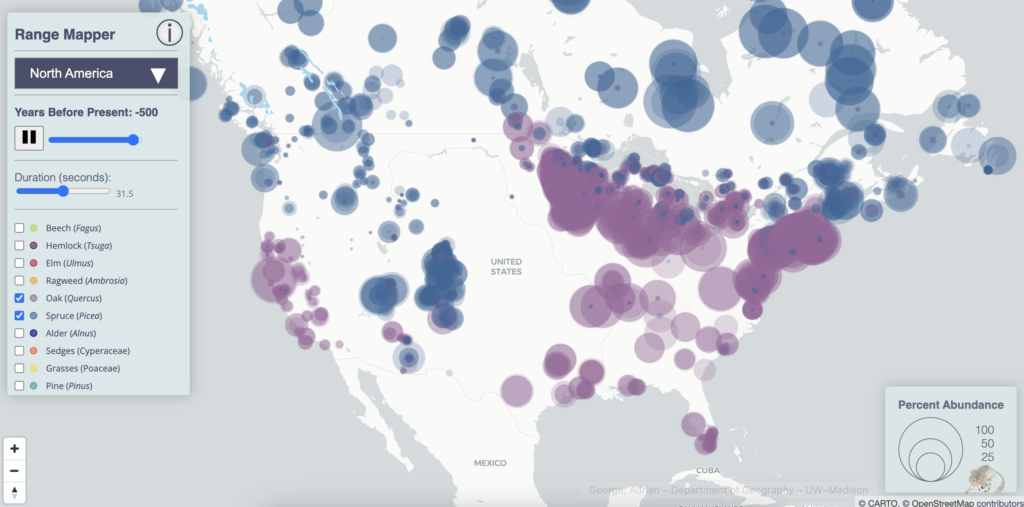
Adrian George, Ph.D. candidate in the UW-Madison Department of Geography, recently published a paper titled “Range Mapper: An Adaptable Process for Making and Using Interactive, Animated Web Maps of Late-Quaternary Open Paleoecological Data.” Range Mapper is an online interactive and animated tool depicting maps of trees, shrubs, and grass distributions and their changes in North America, Europe, and Oceania since the peak of the last Ice Age. The inspiration for the Range Mapper project came about when an older tool, Pollen Viewer, became outdated. So, in a collaborative effort, Adrian George, Professors Jack Williams and Rob Roth, and undergraduate student Sydney Widell created Range Mapper, a new tool to track shifting vegetation.
The Range Mapper tool is not just a set of visualizations. It is also a set of workflows that can guide users through making their own type of map for different time eras and locations. Adrian also said the tool “is a good way to have a first look at pollen data to see what hypotheses you should explore.” Range Mapper is an educational tool that can be used in classrooms to help people visualize how plants shift and move when the climate changes. It is also an illuminating tool for use by scientists experts in paleoecology.
“People are excited to extend the tool to other taxa and other regions,” said Adrian. Range Mapper has the potential to be used to visualize shifts in other paleo data types, such as mammoth distributions. Overall, this tool is a great way to help understand the links between climate change and plant responses through animated visualizations.
Check out the Range Mapper here: https://geography.wisc.edu/rangemapper/