An in-depth look at the importance of railroads and mapping in the nineteenth century through the particular lens of their cultural significance for the United States, expanding on the brief statement in our 2024 outreach letter (companion articles at 2024 Outreach Extras).
Please consider contributing your support to the international effort that is the History of Cartography Project – click “Make A Gift” at right to donate online!
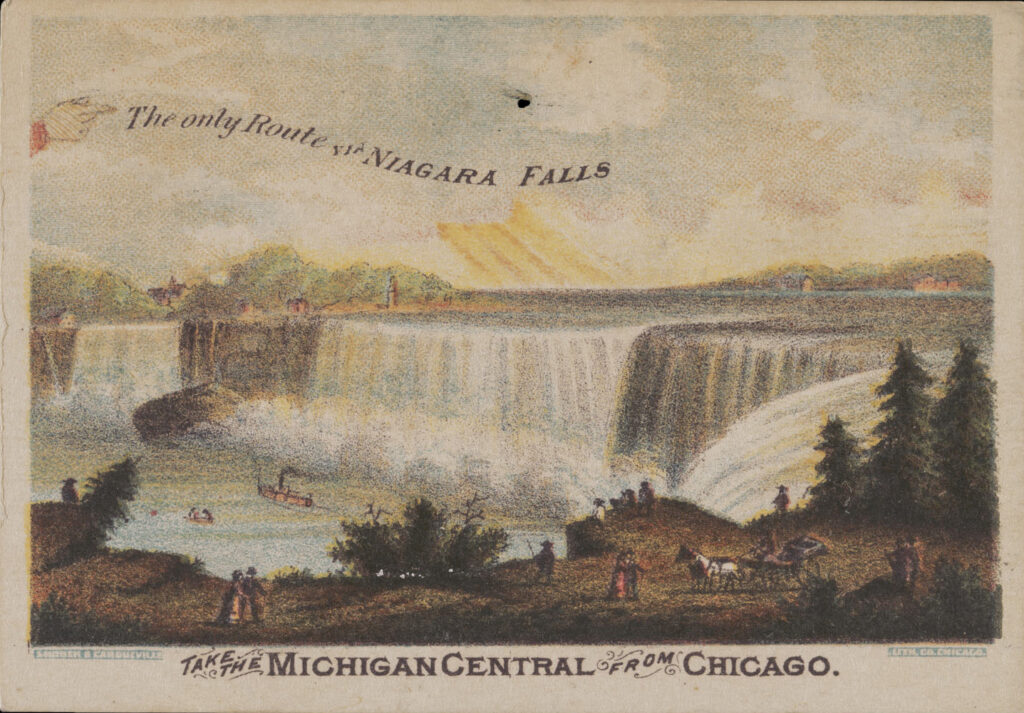
From the visualization and exploration of proposed routes to the detailed surveys and engineering plans for constructing tracks and stations, maps were crucial to the emergence of railroads after 1830. Maps helped railroads to operate and guided riders through interlocking railroads; they promoted both newly accessible routes and commercial sites for tourists, from Niagara Falls to Yosemite (fig. 1); and they helped make grand statements of the national and imperial expansion enabled by the railroad (Musich 2006, 98–116). Intersections of railways and mapping therefore permeate Cartography in the Nineteenth Century, Volume 5 of The History of Cartography.
This essay explores some of those intersections through examples from the United States. Railroads completely redefined American spaces, from small places to national and imperial regions, enabling the territorial dispossession of indigenous peoples across the continent and their replacement by colonizing Europeans. Railroads intruded into all economic activities even as they extended them to create the modern United States. They promoted mineral extraction and agriculture, industrialization and trade. As local trolleys, railroads marked the end of the cramped “walking cities” along the east coast and generated urban and suburban sprawl, while larger, longer-distance trains connected towns, cities, and eventually the coasts. Longer-distance routes required the standardization of time and new maps that downplayed the political and regulatory spaces of states in order to show networks of places strung out along railroads like pearls on a necklace; general state maps (“map of Wisconsin”) became maps of railroads (“railroad map of Wisconsin”). The country itself became an almost organic network of industrial, agricultural, and demographic connectivity. Railroad maps captured the country’s growth and transformation, symbolizing the triumphal progress of European civilization over the peoples and lands of the continent.
Connecting the Country: The Transition from Canals to Railroads
The character of the early development of railroads is evident from a series of maps from the 1830s. In A Connected View of the Whole Internal Navigation of the United States, Natural and Artificial; Present and Prospective (1826), George Armroyd described all of the navigable waterways in the eastern United States, from New England to Florida, whether natural rivers or artificial canals, in use or proposed. He included maps of each region or state, in which constructed waterways were colored with red lines and those planned with yellow.
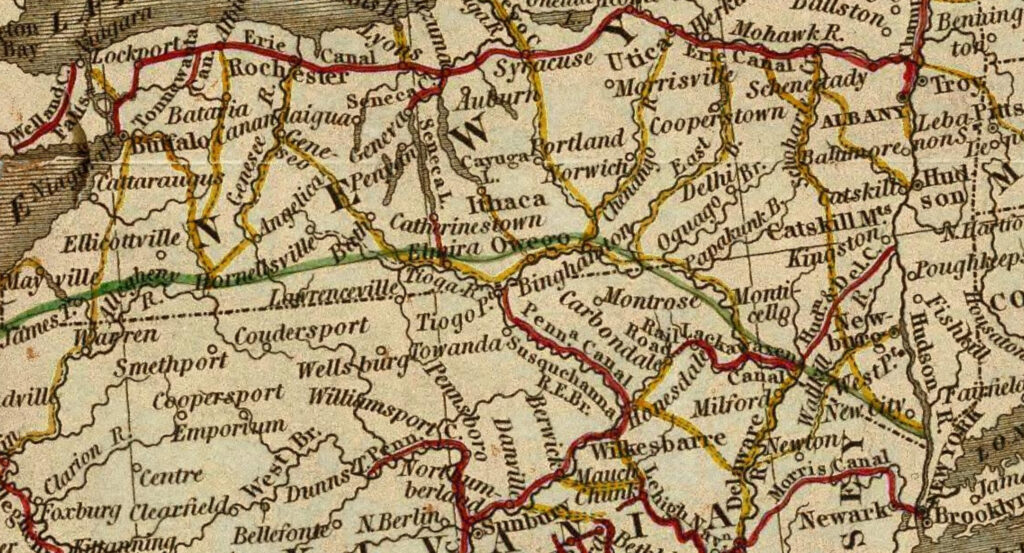
In the much-expanded second edition (1830), Armroyd added the railroads that were then just being planned and built. The newly prepared single map of the eastern United States, by Henry Schenk Tanner, showed both canals and also the first railroads. Figure 2 portrays a detail of upstate New York. The red line running across the top of the figure, just south of Lake Ontario, is the Erie Canal leading from Lake Erie at Buffalo to the Hudson River, navigable all the way to New York City and the Atlantic Ocean at lower right. The Erie Canal had opened in 1825, leading to new European settlement and agricultural development all along the southern shores of the Great Lakes. The yellow lines are proposed canals that would connect southward from the Erie Canal, through the Finger Lakes, to the Allegheny and Chenango Rivers and associated canals. The green line is a proposed railroad through New York state’s Southern Tier. If you look closely, just to the right of center, in Pennsylvania, there is one, thin, short, dark red line labeled “Rail R.” already built from the head of the Lackawanna Canal to Carbondale. This short railroad is emblematic of the initial railroads built to carry minerals and ores (here, anthracite coal) in bulk from the mines to navigable waterways (see Armroyd 1830, 577 and 127–29).
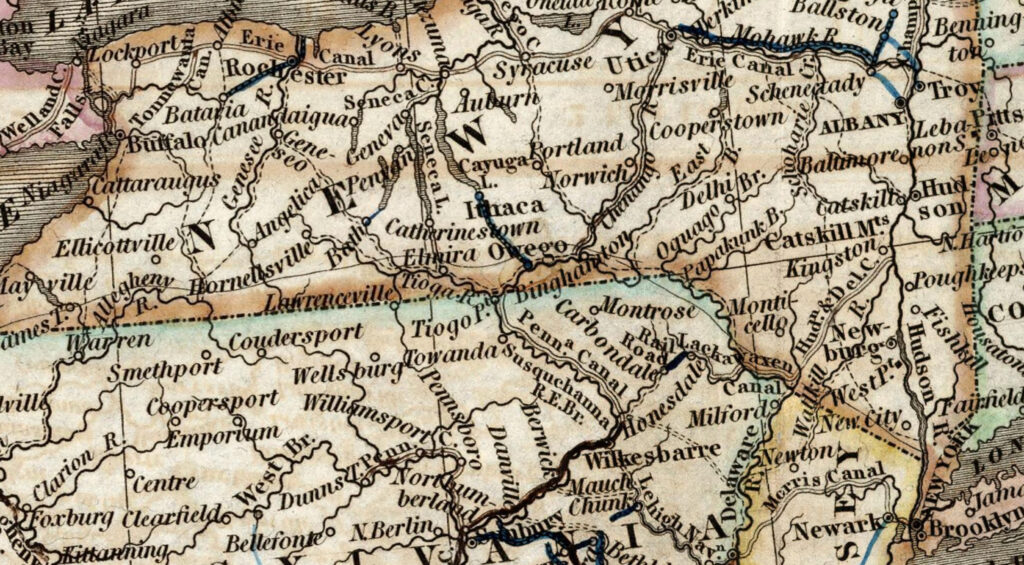
The updated map that appeared in Tanner’s 1834 guide to U.S. canals and railroads is highly revealing in what it does and does not show. The shift to emphasize rail is evident in the coloring: canals are uncolored, just two solid lines for an operating canal (notably the Erie Canal) and two dashed lines for a projected one, but the single line of operating railroads are highlighted in black, with planned railroads as single dashed lines; someone has further annotated this particular copy with more railroads in blue (fig. 3). The mesh of proposed canals across the Finger Lakes are now the single lines of proposed railways. The lone short railroad from the Lackawanna Canal to Carbondale is now joined by several others, such as that from Ithaca (at the head of Cayuga Lake) south to Oswego and the Susquehanna River. It is perhaps telling that the thin solid line following the long-distance route through the Southern Tier, proposed before 1830, is not colored as an actually active railroad nor dashed as a projected one.
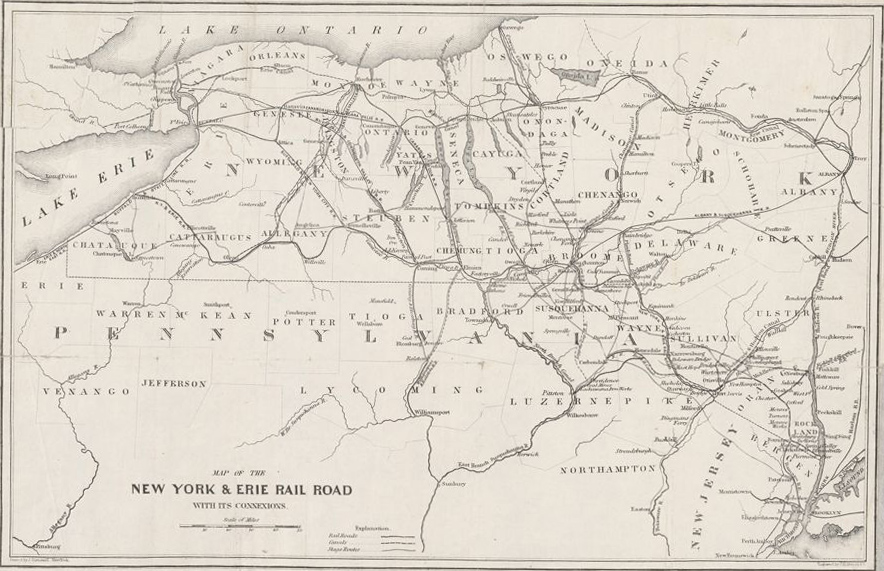
By 1851, the region’s canals are almost a memory (fig. 4). The New York & Erie Rail Road (soon reorganized as just the Erie Railroad) now ran across the Southern Tier; another line running westward from Albany paralleled and bypassed the Erie Canal, and still more rails were planned across the region. Meanwhile, in northeast Pennsylvania, the short Carbondale railroad has been bypassed by a newer, longer railroad from the canal to the Susquehanna River via the Providence coal mines and the Lackawanna Iron Works.
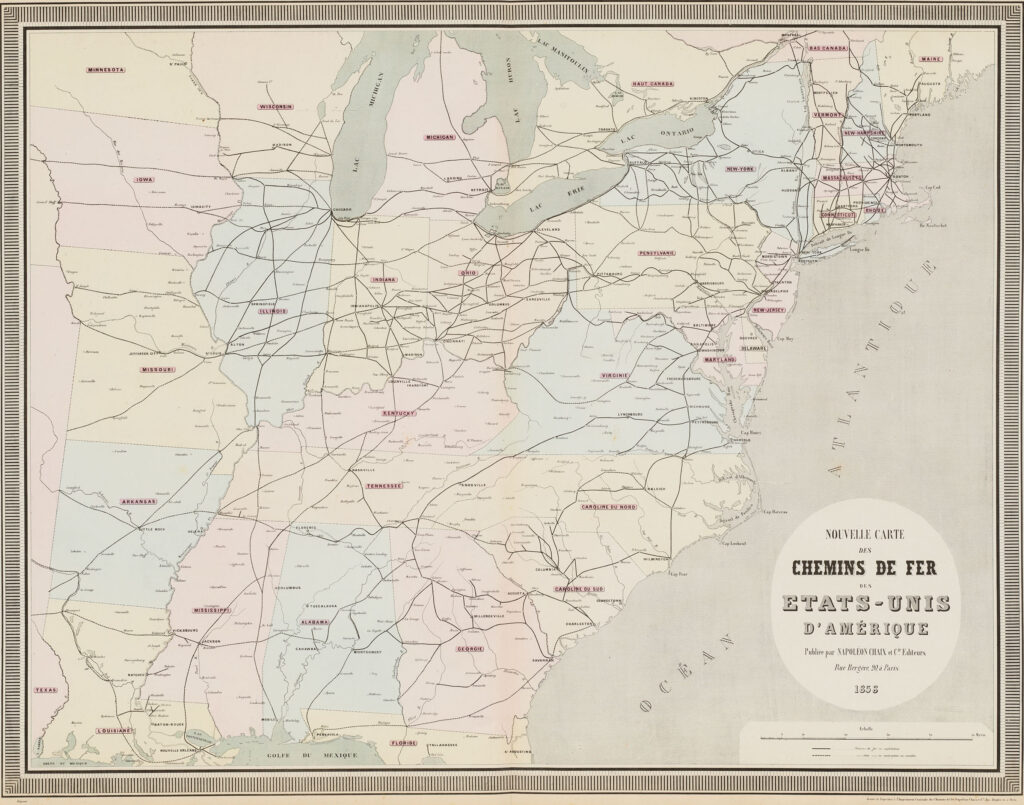
The great majority of railroads were built in the northern states. In the southern states, plantation agriculture deploying slave labor had grown up around navigable waterways, and there was little need to augment them with artificial canals and railroads. The result was a marked spatial difference in the density of railroads in antebellum America, a difference that was captured by a map in an 1858 French atlas of maps of railroads by country (fig. 5). While the northern states were crisscrossed with a fairly dense network of lines reaching from the coast to the Mississippi River, the southern states featured a much sparser network largely defined by the northeast southwest trend of the regions hill chains. As is well known to military historians, this differential development of railroads would have great significance for the Union’s eventual victory in the Civil War (1861–65).
Expanding the Country: Reaching across the Continent
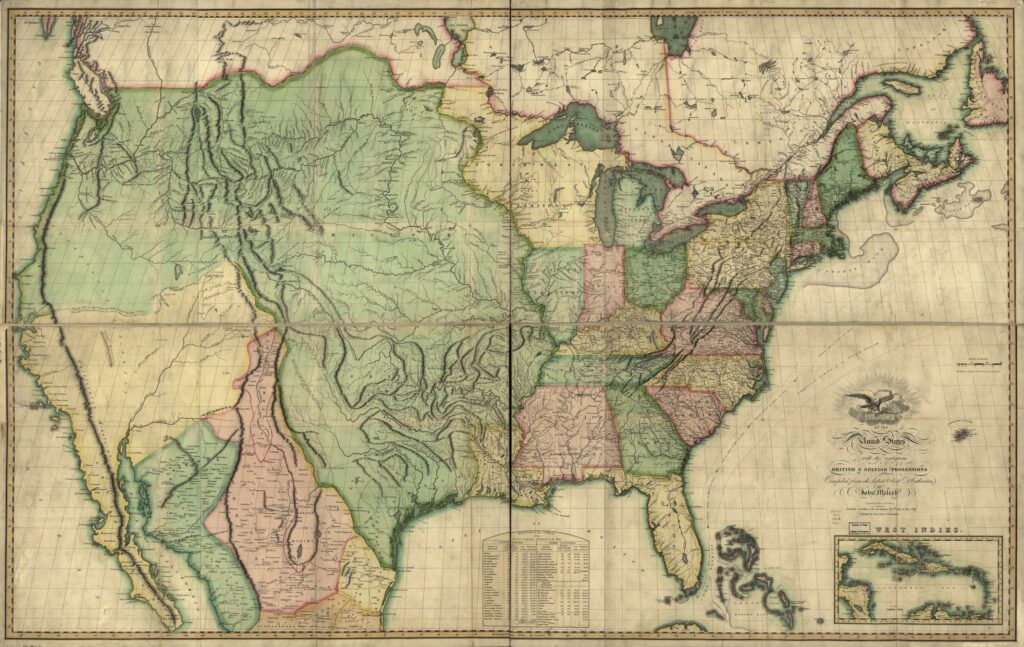
Thomas Jefferson’s 1803 acquisition of the Louisiana territory from France dramatically increased the United States’s political and territorial claims (fig. 6), and its transcontinental reach was quickly bolstered by the Lewis and Clark expedition (1804–6). Yet the United States remained neither interested nor capable of forging a firm connection to the distant Pacific Coast for several decades. Through the 1840s, most maps of the young nation continued to map only the eastern half of the country. Even so, further expeditions were undertaken to explore routes across the plains to the Rockies and the Pacific Coast. The Corps of Topographical Engineers, which had been organized in 1838 to manage all engineering projects unrelated to fortifications, undertook a series of surveys in the 1840s, most famously those by John C. Frémont in 1842 and 1843–44, to provide basic information about the West and its peoples (fig. 7) (Goetzmann 1959, 65–108).
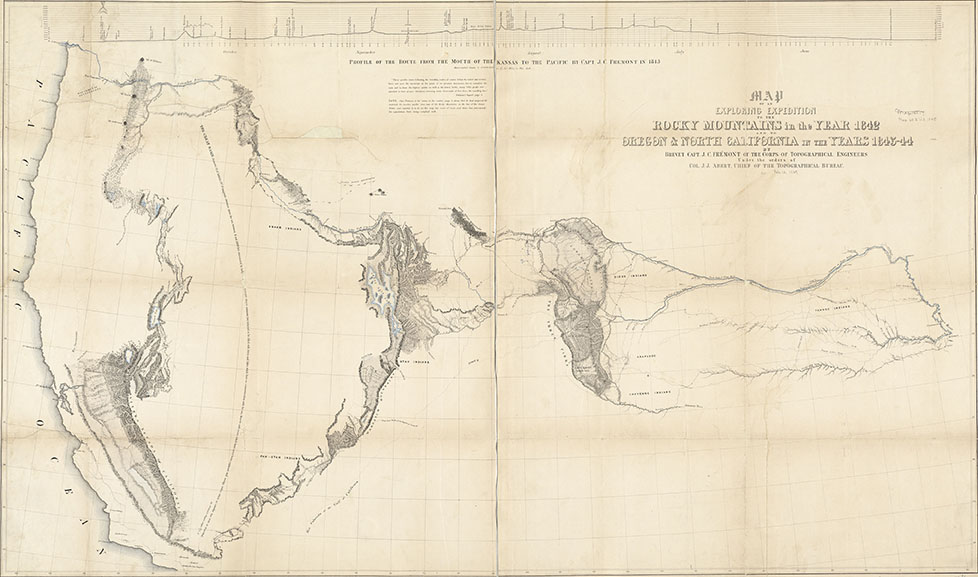
Frémont was famously the protégé (and son-in-law) of Senator Thomas Hart Benson of Missouri. An ardent promoter of westward expansion, Benton championed the idea of Manifest Destiny, the belief that the United States was divinely ordained to expand across North America, and he led the charge to settle the U.S.-Canadian border in the Pacific Northwest (1846) and to annex Texas (1845). That annexation led to the Mexican-American War (1846–48), resulting in the brief independence of northern California before its annexation to the United States along with Nevada, Utah, and most of Arizona (1848). Once again, this territorial growth did not promote the sense that the new territories should be connected to the settled eastern states by any means other than the existing system of rivers and trails. Thus, the 1846 proposal by Asa Whitney to build a railroad from Lake Michigan to Puget Sound was dismissed by a Congressional committee as “too gigantic” and “entirely impracticable” (quoted in Meinig 1998, 5).
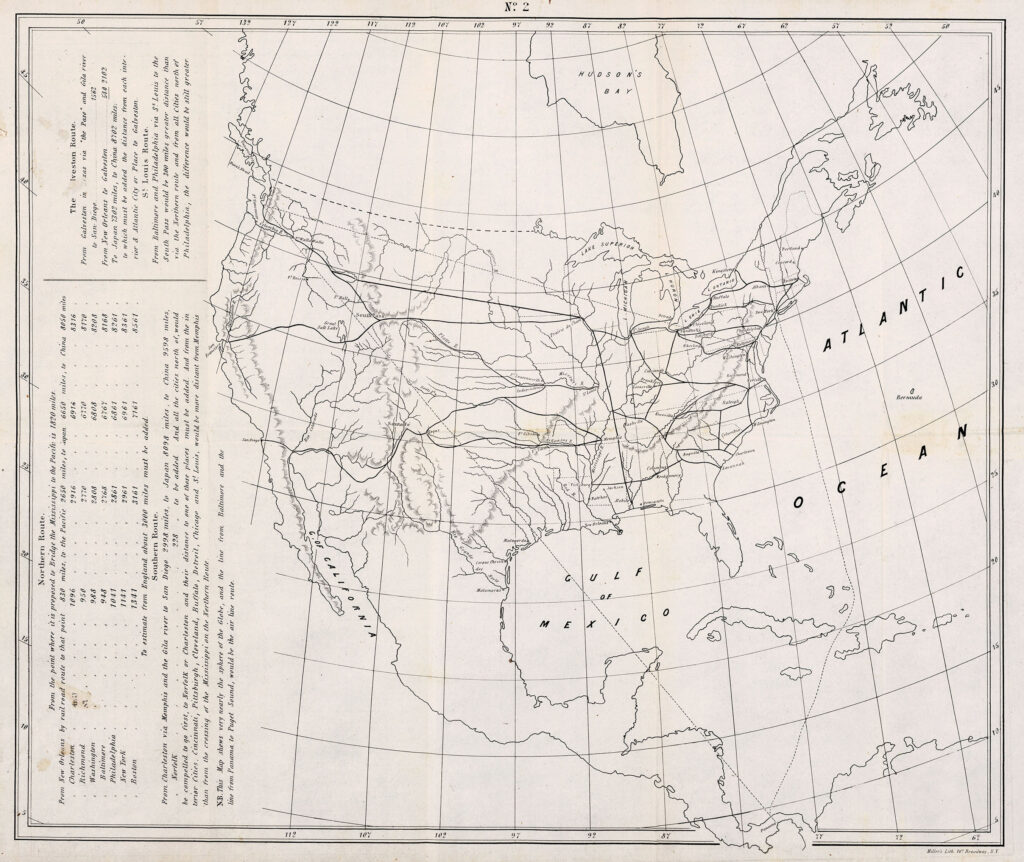
The situation changed with the discovery of gold in California, inland from San Francisco. The lure of these known deposits and the prospect that other valuable minerals would be found across the newly acquired territories prompted the rapid acceptance of the need for transcontinental railroad links; the only question was where they would go (fig. 8). The task of searching for and identifying possible routes was assigned to the topographical engineers (Goetzmann 1959, 262–304), who also mapped the gold fields (Anderson and Anderson 2015). Expeditions led by topographical engineers and staffed by many skilled émigrés who had left Europe after the failure of the bourgeois revolutions across Europe in 1848 were dispatched throughout the 1850s. The result was a detailed elaboration of the potential routes from the Mississippi to the Pacific (fig. 9) based on numerous surveys (Goetzmann 1959, 440–60).
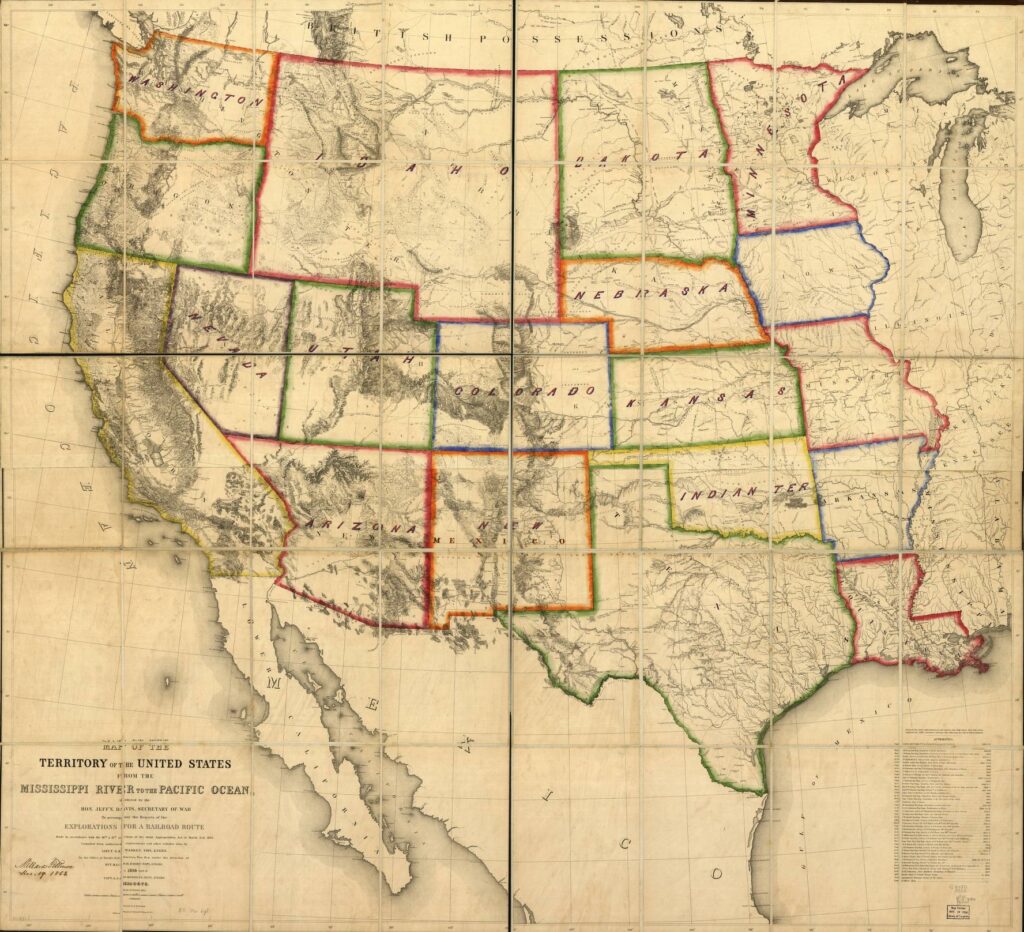
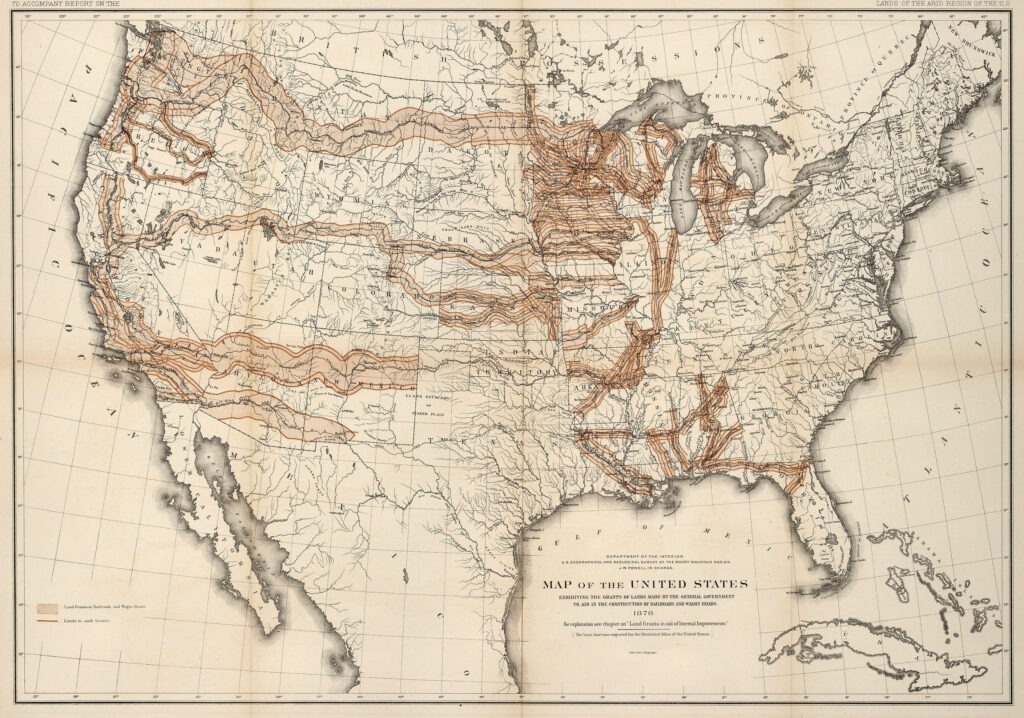
After much debate and political maneuvering, Congress finally authorized the construction of the central route from Omaha, Nebraska, on the Missouri River, to Ogden, Utah (the Union Pacific), and then onto Sacramento and Oakland, California (the Central Pacific) (fig. 10). This great railroad was soon followed by further railroads along northern and southern routes, paid for in large part by grants of land from the public domain to the railroad companies along the intended routes (fig. 11). To sell the lands, and to pay for constructing the railroads, the companies began encouraging emigration to the plains from northern Europe (Meinig 1998, 3–28).
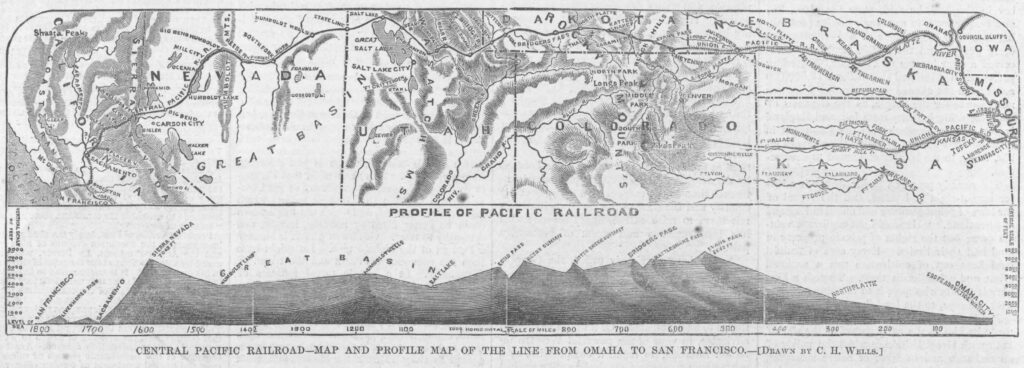
When completed in 1869, with the meeting of the rails just north of the Great Salt Lake, the Union and Central Pacific Railroad
fixed in place the first axis and quickened the pulse of the nation in all its Western extremities. Stage lines now radiated out from its stations to mining camps and to distant regions such as western Montana, Walla Walla, and Oregon, and branch railroads would soon follow as they already had to Denver, Salt Lake City, and Virginia City (Meinig 1998, 27–28).
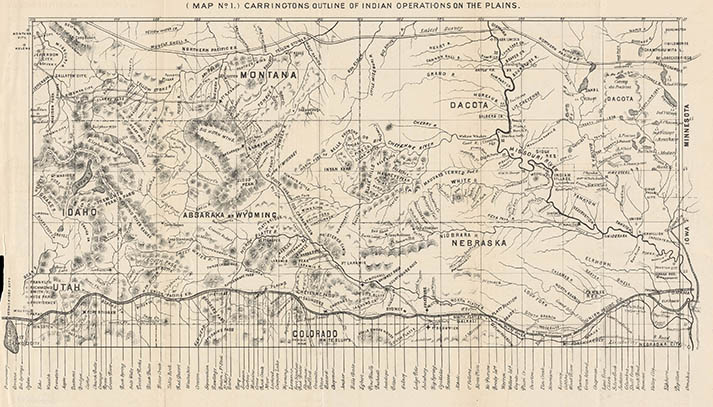
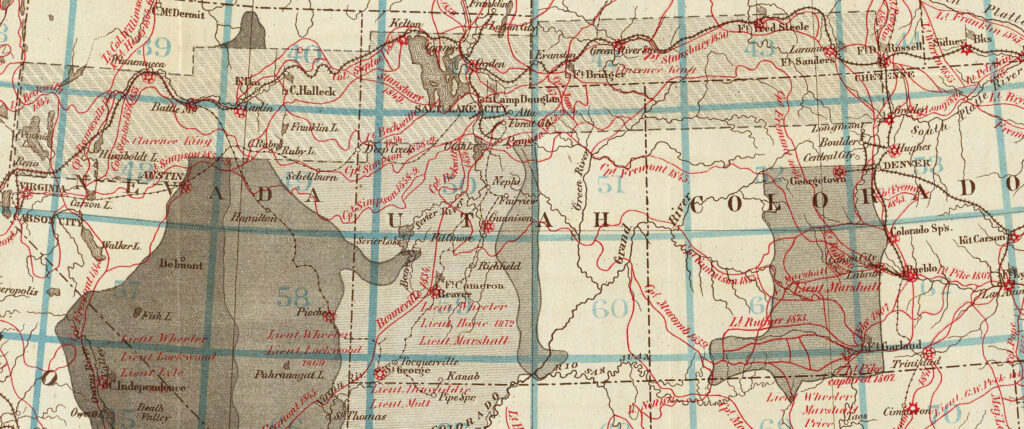
Even before the railroad was fully completed, it gave access to the Great Plains for the U.S. army in its ongoing efforts to subdue indigenous peoples (fig. 12). Once complete, the main line and its offshoots permitted four federal expeditions to be sent out to map the newly accessible region in detail and to assess its potential for agriculture and mining: Clarence King’s U.S. Geological Exploration of the Fortieth Parallel, from 1867, for the Corps of Engineers; Ferdinand V. Hayden’s U. S. Geological and Geographical Survey of the Territories, from 1869, for the Department of the Interior; John Wesley Powell’s Geographical and Topographical Survey of the Colorado River of the West, after 1870 and his famous 1869 descent of the Colorado into the Grand Canyon; and George M. Wheeler’s strictly military Geographical Surveys of the Territories of the U.S. West of the 100th Meridian, after 1871, again for the Corps of Engineers (fig. 13) (Bartlett 1962; Goetzmann 1966, 430–576). The fact that the surveys covered the same parts of the West led to their eventual termination and replacement in 1879 by the newly organized U.S. Geological Survey. Regardless of particulars, the four surveys emblematize all the ways in which European Americans used the railroads to access the lands and resources of the West.
Reconfiguring American Space and Time
The completed Union and Central Pacific Railroad—which represented “the unrolling of a new map…a revelation of new empire, the creation of a new civilization” (Samuel Bowles, The Pacific Railroad—Open: How to Go. What to See [Boston, 1869], quoted in Danzer with Akerman 2016)—was not the only railroad to effectively reconfigure the American experience of place and space. The spatial effects of all the railroads were profound.
Innumerable maps and bird’s-eye views of American villages, towns, and cities testify to the tremendous changes wrought to urban life by the railroads. As just one example, the railroads developed the city of Haverhill in Massachusetts from a small collection of water-powered mills into a huge industrial complex whose coal and raw materials were supplied by the railroads (fig. 14). The industrial growth was fueled by the easy export of Haverhill’s finished leather goods by sea and the city’s location on the tidal reach of the Merrimac River but also just thirty-three miles via the Boston & Maine Railroad from the port at Boston.
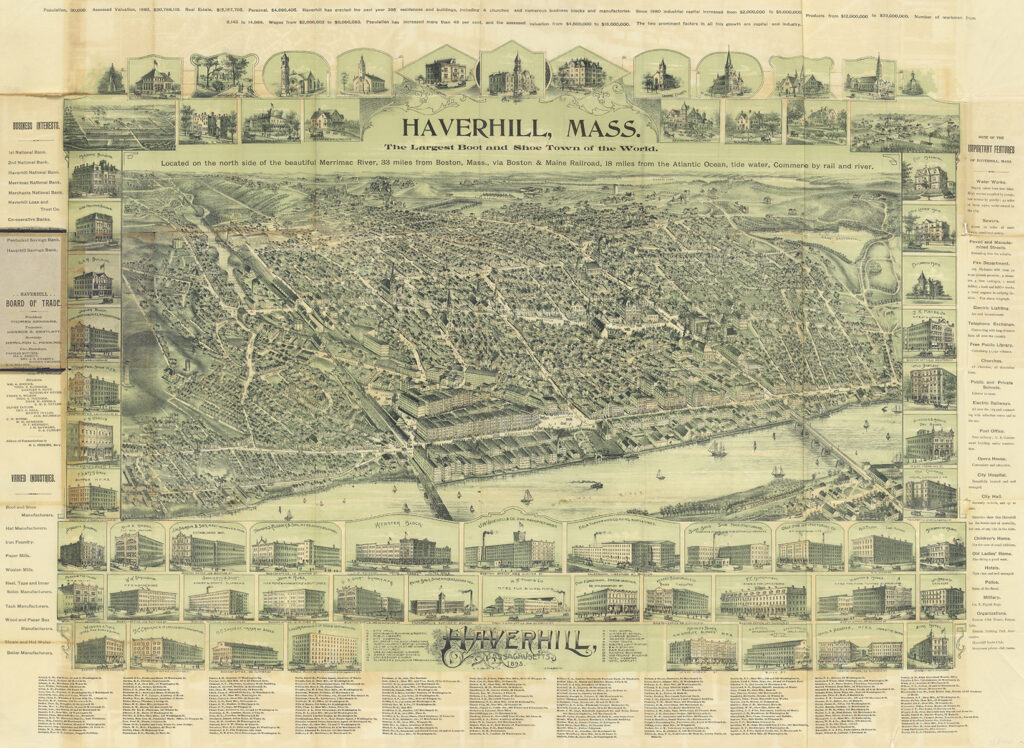
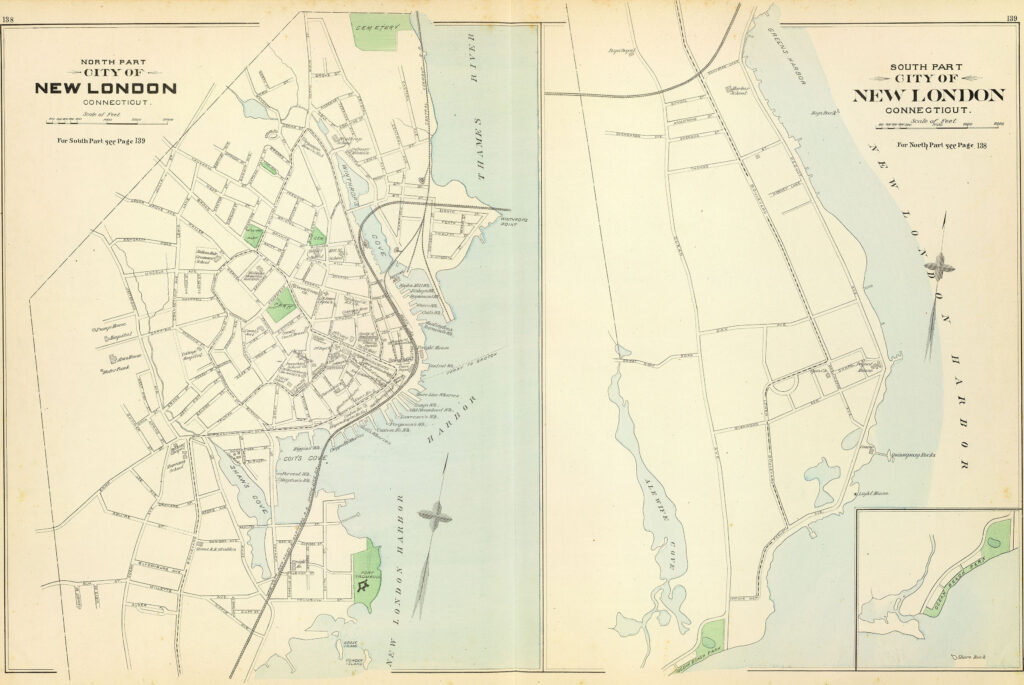
Close examination of the view of Haverhill reveals some smaller tracks running along the streets. These were for the trolleys that moved people across cities. Before the trolleys, U.S. cities were “walking cities.” People walked everywhere and society was divided vertically: the most expensive apartments were on the easily accessible second floor (with shops and workrooms on the first); the higher the story, the more stairs, the cheaper the rent, until the garrets beneath the roofs populated by starving artists. Trolleys allowed the better off to live in leafy “streetcar suburbs,” in their own houses, and to commute daily to work (men) and to shopping (women) in the historic core of the town. The new suburbs drastically increased the areas of cities and horizontally segregated the poor from the wealthy (Warner 1962; Domosh 1996). The effects are readily evident in detailed plans of towns from the later nineteenth and early twentieth centuries (fig. 15).
Of all the cities enhanced by the railroad, none was more profoundly affected than Chicago. The early settlement at the mouth of the Chicago River as it flowed into Lake Michigan was rapidly transformed into a huge industrial center, processing grain and cattle from the plains and ores shipped through the lakes. Asa Whitney might have anticipated the growth of St. Joseph as the great railroad hub, on the opposite lakeshore in Michigan (fig. 8), but it was the combination of the improvable port and the potential for interior canals cutting across to the Illinois River and the great Mississippi that encouraged Chicago’s emergence as the great railroad freight hub (Cronon 1991).
Widening the spatial scope, railroads reconfigured the organization of individual states. Each U.S. state is an historical and political creation but not a single economic or demographic entity. As railroads were built across states, they served to bring the different regions together. Ohio, Indiana, and Illinois, for example, were initially developed by colonists who came up the Mississippi and Ohio Rivers from the south; the opening of the Erie Canal in 1825 led to the agricultural settlement and development of their northern regions, such that their northern and southern regions remain culturally distinct even to this day. On the other hand, their connection by railroads prompted the formation of single economies (fig. 16). After the Civil War, U.S. atlas publishers and other mapmakers increasingly called their maps of individual states, “railroad maps” of the states, not just to emphasize how the maps show the railroads but also to indicate how the railroads were binding the state together (fig. 17).
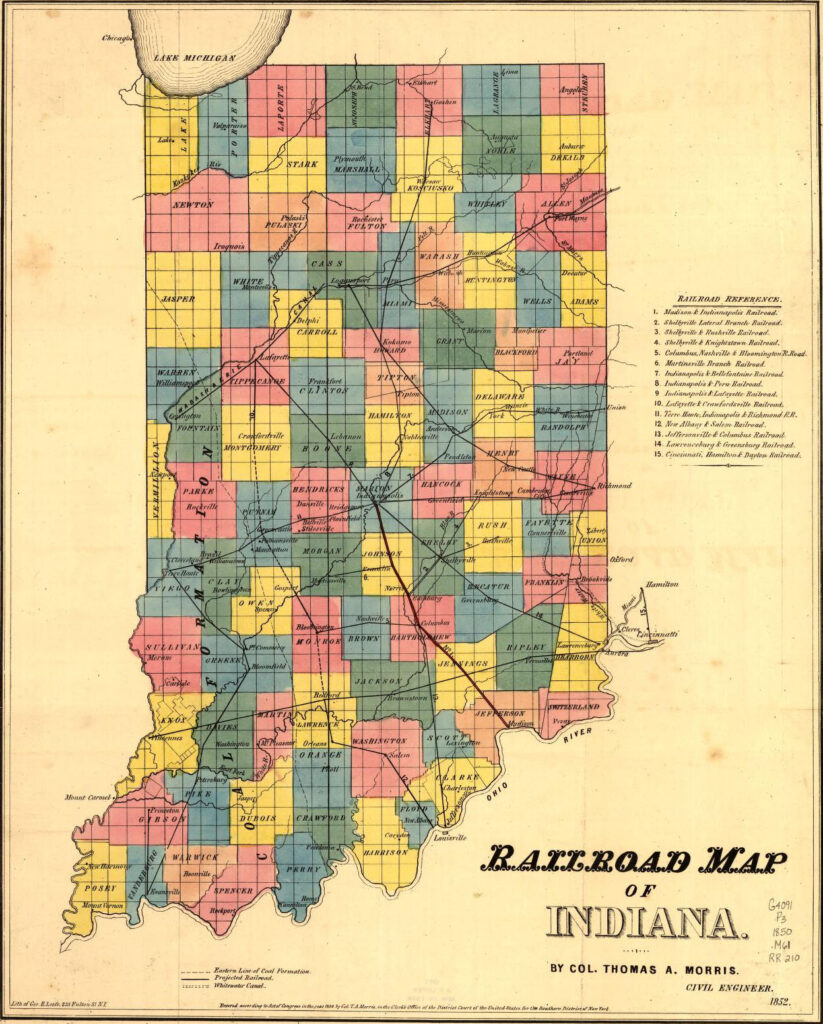
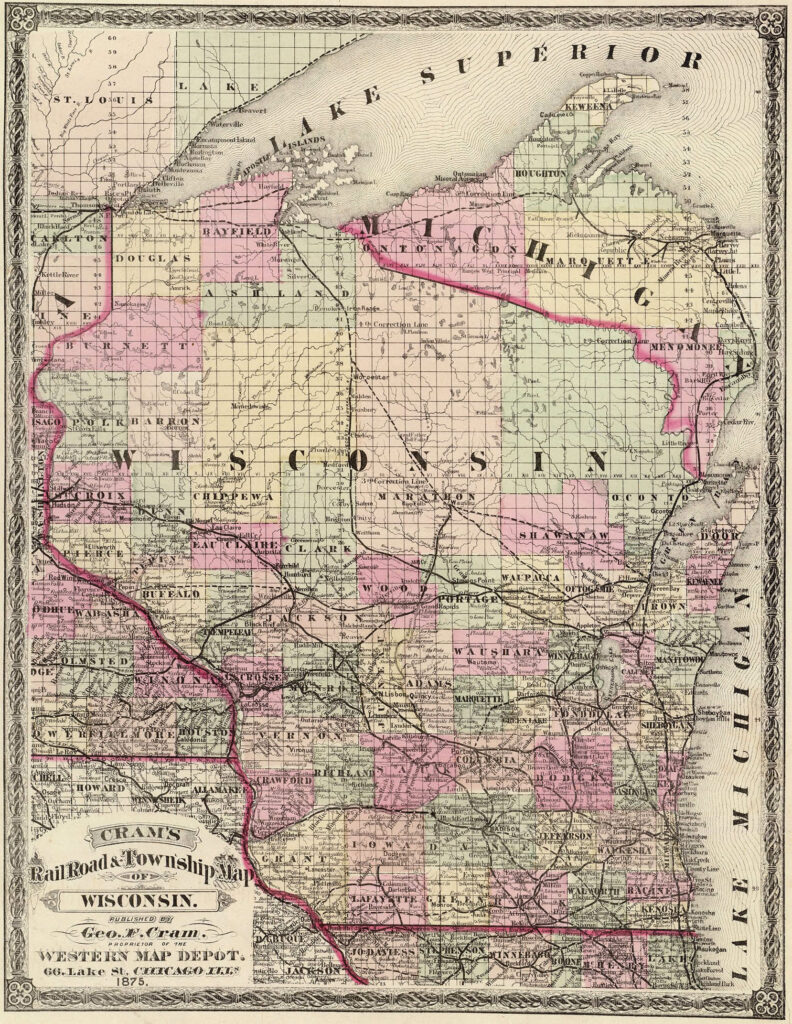
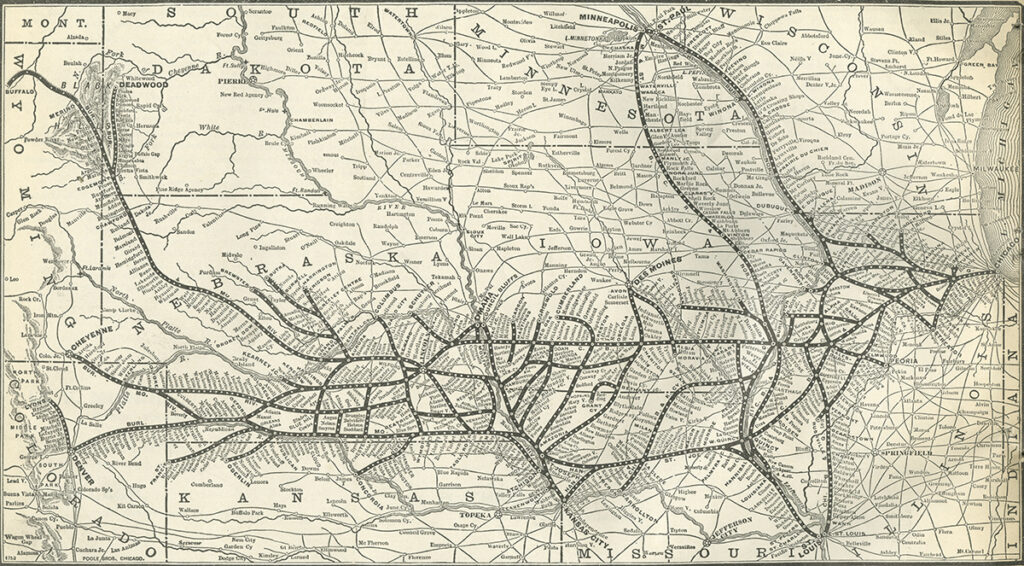
Conversely, the extension of railroads across states had the effect of playing down the political boundaries as the focus was on the railroad’s connections. This trend was emphasized by the consolidation of individual railroads into railroad systems (Musich 2006, 123–35). To show the railroads and their main routes, with pearl-like stops equidistant along thick black lines, and then with thinner lines showing all the further railroads to which one might then connect, guide maps surrendered topographical accuracy for the topological geometry of connectivity (fig. 18). These maps are about spatial connections, both economic and personal, that permit access to the country and its resources.
Furthermore, the growth of interconnecting railroads required the creation of an infrastructure to permit the network to function. Physically, railroads were steadily adapted to the same width (gauge) so that rolling stock might easily be moved from one to another. Conceptually, they needed to run on the same time to prevent the disaster of two trains occupying the same space in the same moment. With each railway company standardizing its own time, accidents were inevitable. The Valley Falls collision in Rhode Island in August 1853, the first in the United States known to be photographed, was caused by one conductor using a personal watch that did not keep time well; the result was the requirement adopted throughout New England of the use of official, high-quality timepieces set to a standardized time (Stephens 1989). Various proposals were debated through the 1870s, in the United States and also in Canada, for a more general standardization of clock time. Eventually, a trade convention of U.S. railroad companies agreed in 1883 to use four standardized time zones as proposed by the engineer William F. Allen (fig. 19). Significantly, these four standardized time zones—Eastern, Central, Mountain, and Pacific—were defined not by the territories (states) that they covered but only by the railroads themselves.
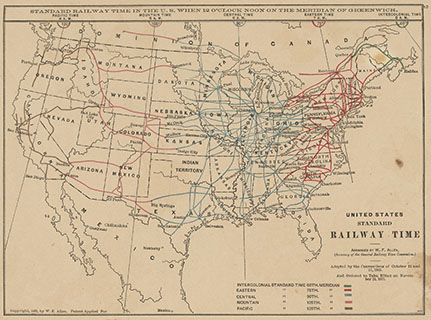
The grand standardization occurred on 18 November 1883, prompting cities and states across the country to adopt the same four time zones for their own civic needs. The time zones were adopted by the federal government in 1918, converting a network of time into regions of time. In this process, clocks across the United States came to possess a certain uniformity, differing in the placement of the hour hand, but all showing the same minutes and seconds (O’Malley 1990; Bartky 2007, 70–72; Withers 2017, 129–31). With clocks synchronized by time signals sent out via telegraph from the U.S. Naval Observatory, railroads led to “the idea of a single, uniform fabric of time” becoming “second nature in…America” (Rosenberg and Grafton 2010, 180).
Railroads as Symbols of Progress
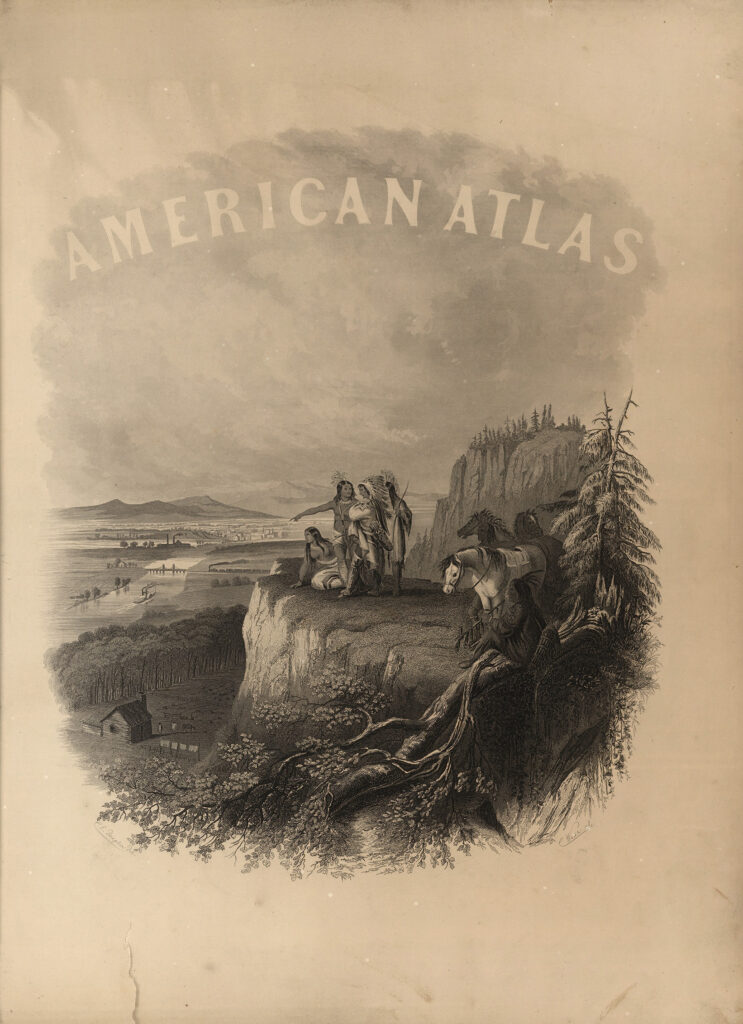
The ideology of Manifest Destiny was made evident in Carl Emil Doepler’s design for the frontispiece of A. J. Johnson’s atlas of 1864 (fig. 20). The main foreground comprises a group of stereotyped indigenous figures on a mountain ledge, watching impotently as European Americans build their nation and head west. The scene below them reads both spatially and chronologically, from the frontier log campaign of the eastern woodlands in the lower foreground, across a great river (the Mississippi?) that is both an avenue for travel but also being bridged by a railroad, and across industrial cities and agricultural plains to the distant mountains in the west. The same sentiments are writ large in Fanny Palmer’s design for Currier & Ives (fig. 21). Published ca. 1868 when the completion of the first transcontinental railroad was imminent, the image again presents indigenous peoples as being bypassed by history, as the “Through Line New York San Fransisco” steam train pulls away before forging ahead to surpass the old wagon trains.
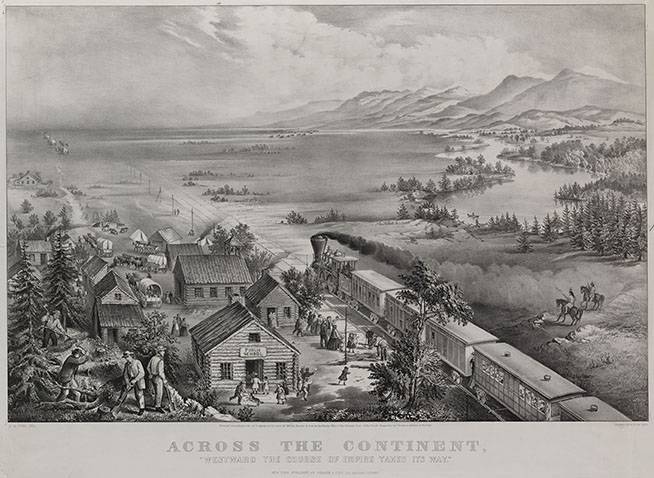
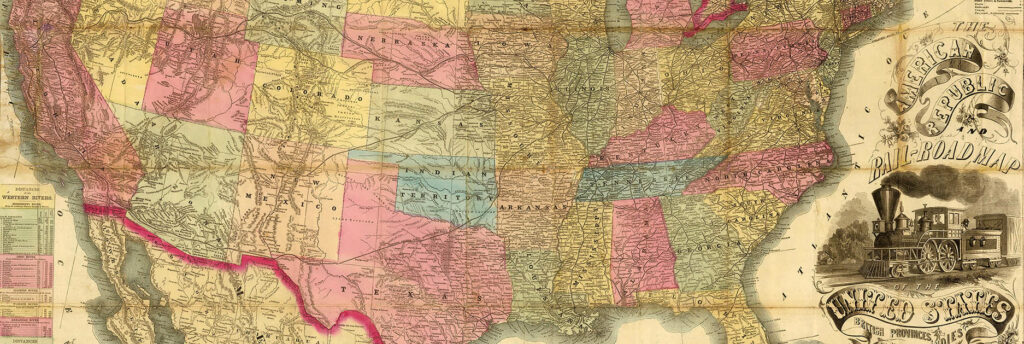
The railroad was a key symbol in literature for European Americans of their cultural, economic, and national progress (Marx 1964) as well as in art and ephemera such as board games. After 1848, maps of the country displayed new and proposed railroad lines well before they had been built across the continent (fig. 22).
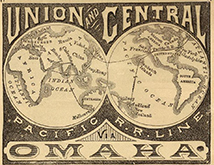
But it is in the imagery surrounding the railroads that the ideology of progress through new connections really stands out. Consider two examples associated with the Union and Central Pacific Railroad. An 1871 pamphlet about the new railroad highlighted the comfort of its trains and the access it gives to the natural wonder of Yosemite, but it also included a telling world map on its outer cover (fig. 23). The map depicts a line from Britain to New York across the Atlantic, then the “Pacific RR” to San Francisco, from which further tracks extend out into the Pacific to China, New Zealand and Australia, to India, and to the Suez Canal and thence back to Europe and Britain. The transcontinental railroad did not just connect the continent, it connected the United States with the whole world! At the same time, the cover to a board game for the rail journey from New York to San Francisco depicted not some continental scene but rather the meeting of the United States (as Lady Liberty) and Asia in front of an ocean between an industrial U.S. port (all ships leaving) and a Chinese port (all ships entering), as if the train itself was bringing U.S. trade goods to Asia (fig. 24).
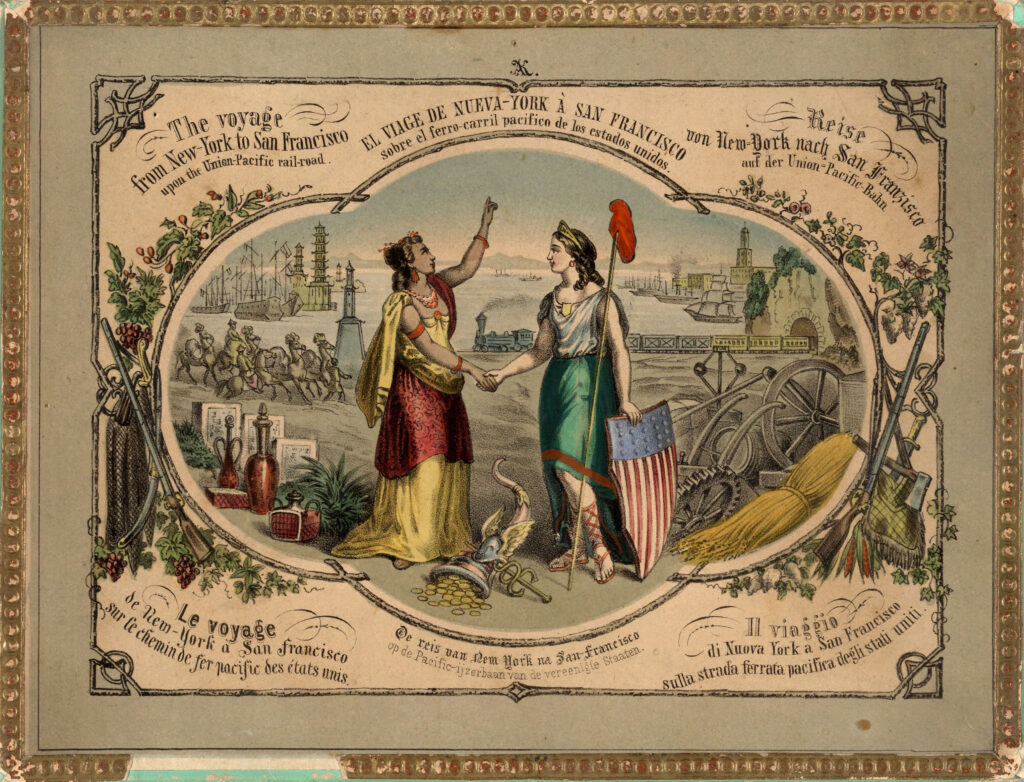
These hints at the interconnectivity of railroads and steam ships point to the manner in which railroads enabled new empires to be formed in continental interiors. The great nineteenth-century empires are often referred to as “maritime empires” because of their foundation on oceanic voyaging. But it is perhaps more appropriate to call them “empires of steam” because of the utilization of both steam ships to ease and speed oceanic connections and of railroads to push imperial power from the old coastal centers of imperial power into the interiors (Headrick 1981).
For the United States, this unity of mobility, national growth and integration, and future progress all come together in a remarkable and rare wall map printed by Rand McNally in 1889 for the Land & River Improvement Co. of West Superior, Wisconsin (fig. 25). Claiming a “resemblance between the arteries of commerce, as represented by railroads, and the arterial system of man,” the map placed West Superior at the very heart, from which arteries ran westward. The man’s feet are firmly planted on Britain and Spain, and the body is aligned with the host of railroads across the northern states; at the west, the man’s arms are reaching out into the Pacific, stretching to reach Japan and Russia to embrace them in the U.S.-Atlantic trade network. After describing the anatomical equivalencies, the “Explanatory Notes” at bottom right end with key comments:
A careful study of this chart will convince the student that there is a most wonderful analogous resemblance between the development of commerce in North America and the anatomical development of man. It is an interesting fact that in no other portion of the known world can any such analogy be found between the natural and artificial channels of commerce and circulatory and digestive apparatus of man.
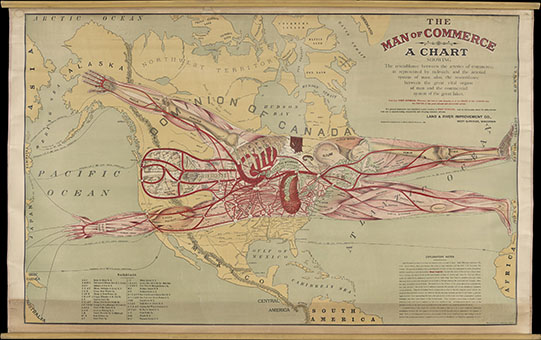
The map demonstrates how the United States is indeed unique and truly exceptional. In line with the analogy commonly drawn between states and organisms within contemporary political, sociological, and geographical thought, the Man of Commerce mapped out the country as literally an organism. The United States was not some old-world political entity founded on feudal or despotic relationships, but it had developed organically as the only trading and commercial state. The essence of the United States is its commerciality and its connectivity, and it was destined to keep growing westward across the Pacific.
Conclusion
There is, to conclude, an important way in which railroad mapping significantly influenced the popular understanding of maps and mapmaking. Through the eighteenth century and into the early nineteenth century, it was common for the titles of regional maps to proclaim that they had been “based on the latest surveys.” By and large, few actually had been, and it seems that at least some consumers of such maps appreciated this fact. Today, by contrast, it is widely expected that maps are indeed based on the latest data, such that we get quite dismayed when we find that a map is wrong in its features. What happened? In part, the shift in expectations can be attributed to the increasing application of territorial surveys across Europe and its empires. (This is another major theme running through Volume Five!) But the change in expectations seems also to have been a result of the railroads. After 1830, the U.S. public, and more generally the public in the industrializing countries, consumed railroad maps in a host of guidebooks and timetables. Publishers used the same maps in atlases, in guidebooks, and as separate publications folded down within small covers (as fig. 17). Whether traveling for business or for personal pleasure, people looked to the maps to be accurate and up-to-date in their delineation of routes, stops, and connections. Regional maps ceased to be marketed as being based on the latest surveys: it was increasingly expected that they were so. The railroads not only reconfigured space and time, they also reconfigured the popular conception of mapmaking.
Matthew Edney
Further Reading
In addition to the works cited, below, you can find much more about mapping and mobility in U.S. history at James R. Akerman and Peter Nekola’s phenomenal Mapping Movement in American History and Culture, online at https://mappingmovement.newberry.org/. The site is well worth a long visit! Reference should also be made to Jerry Musich’s excellent 2006 overview.
References
Anderson, Gary Clayton, and Laura Lee Anderson, eds. 2015. The Army Surveys of Gold Rush California: Reports of the Topographical Engineers, 1849–1851. Norman: University of Oklahoma Press.
Armroyd, George. 1826. A Connected View of the Whole Internal Navigation of the United States, Natural and Artificial; Present and Prospective. Philadelphia: H. C. Carey & I. Lea.
———. 1830. A Connected View of the Whole Internal Navigation of the United States; Natural and Artificial, Present and Prospective. 2nd ed. Philadelphia: George Armroyd.
Bartky, Ian R. 2007. One Time Fits All: The Campaigns for Global Uniformity. Stanford: Stanford University Press.
Bartlett, Richard A. 1962. Great Surveys of the American West. Norman: University of Oklahoma Press.
Cronon, William. 1991. Nature’s Metropolis: Chicago and the Great West. New York: W. W. Norton.
Danzer, Gerald A., with James R. Akerman. 2016. “American Railroad Maps, 1828–1876.” In Mapping Movement in American History and Culture, ed. James R. Akerman and Peter Nekola. Chicago: Newberry Library. Online at https://mappingmovement.newberry.org/american-railroad-maps-1828-1876/.
Domosh, Mona. 1996. Invented Cities: The Creation of Landscape in Nineteenth-Century New York & Boston. New Haven: Yale University Press.
Goetzmann, William H. 1959. Army Exploration in the American West, 1803–1863. New Haven: Yale University Press.
———. 1966. Exploration and Empire: The Explorer and the Scientist in the Winning of the American West. New York: Alfred A. Knopf.
Headrick, Daniel R. 1981. The Tools of Empire: Technology and European Imperialism in the Nineteenth Century. Oxford: Oxford University Press.
Marx, Leo. 1964. The Machine in the Garden: Technology and the Pastoral Ideal in America. New York: Oxford University Press.
Meinig, D. W. 1998. The Shaping of America: A Geographical Perspective on 500 Years of History, vol. 3, Transcontinental America, 1850–1915. New Haven: Yale University Press.
Musich, Jerry. 2006. “Mapping a Transcontinental Nation: Nineteenth- and Early Twentieth-Century American Rail Travel Cartography.” In Cartographies of Travel and Navigation, ed. James R. Akerman, 97–150. Chicago: University of Chicago Press.
O’Malley, Michael. 1990. Keeping Watch: A History of American Time. Washington, D.C.: Smithsonian Institution Press.
Rosenberg, Daniel, and Anthony Grafton. 2010. Cartographies of Time. New York: Princeton Architectural Press.
Stephens, Carlene. 1989. “‘The Most Reliable Time’: William Bond, the New England Railroads, and Time Awareness in 19th-Century America.” Technology and Culture 30:1–24.
Tanner, Henry Schenk. 1834. A Brief Description of the Canals and Rail Roads of the United States: Comprehending Notices of All the Most Important Works of Internal Improvement throughout the Several States. Philadelphia: H. S. Tanner.
Warner, Sam Bass, Jr. 1962. Streetcar Suburbs: The Process of Growth in Boston, 1870–1900. Cambridge: Harvard University Press.
Weber, Joe. 2024. “The Unfinished Wheeler Atlas of the American West: Reassessing the Value of a Nineteenth-Century Mapping Project.” Imago Mundi 76:17–36.
Withers, Charles W. J. 2017. Zero Degrees: Geographies of the Prime Meridian. Cambridge: Harvard University Press.
