
Consider these examples of hydrographic maps as you read about other technical and scientific methods of mapping that developed in the nineteenth century. Visit 2025 Outreach Extras to learn more.
Please consider contributing your support to the international effort that is the History of Cartography Project – click “Make A Gift” at right to donate online!
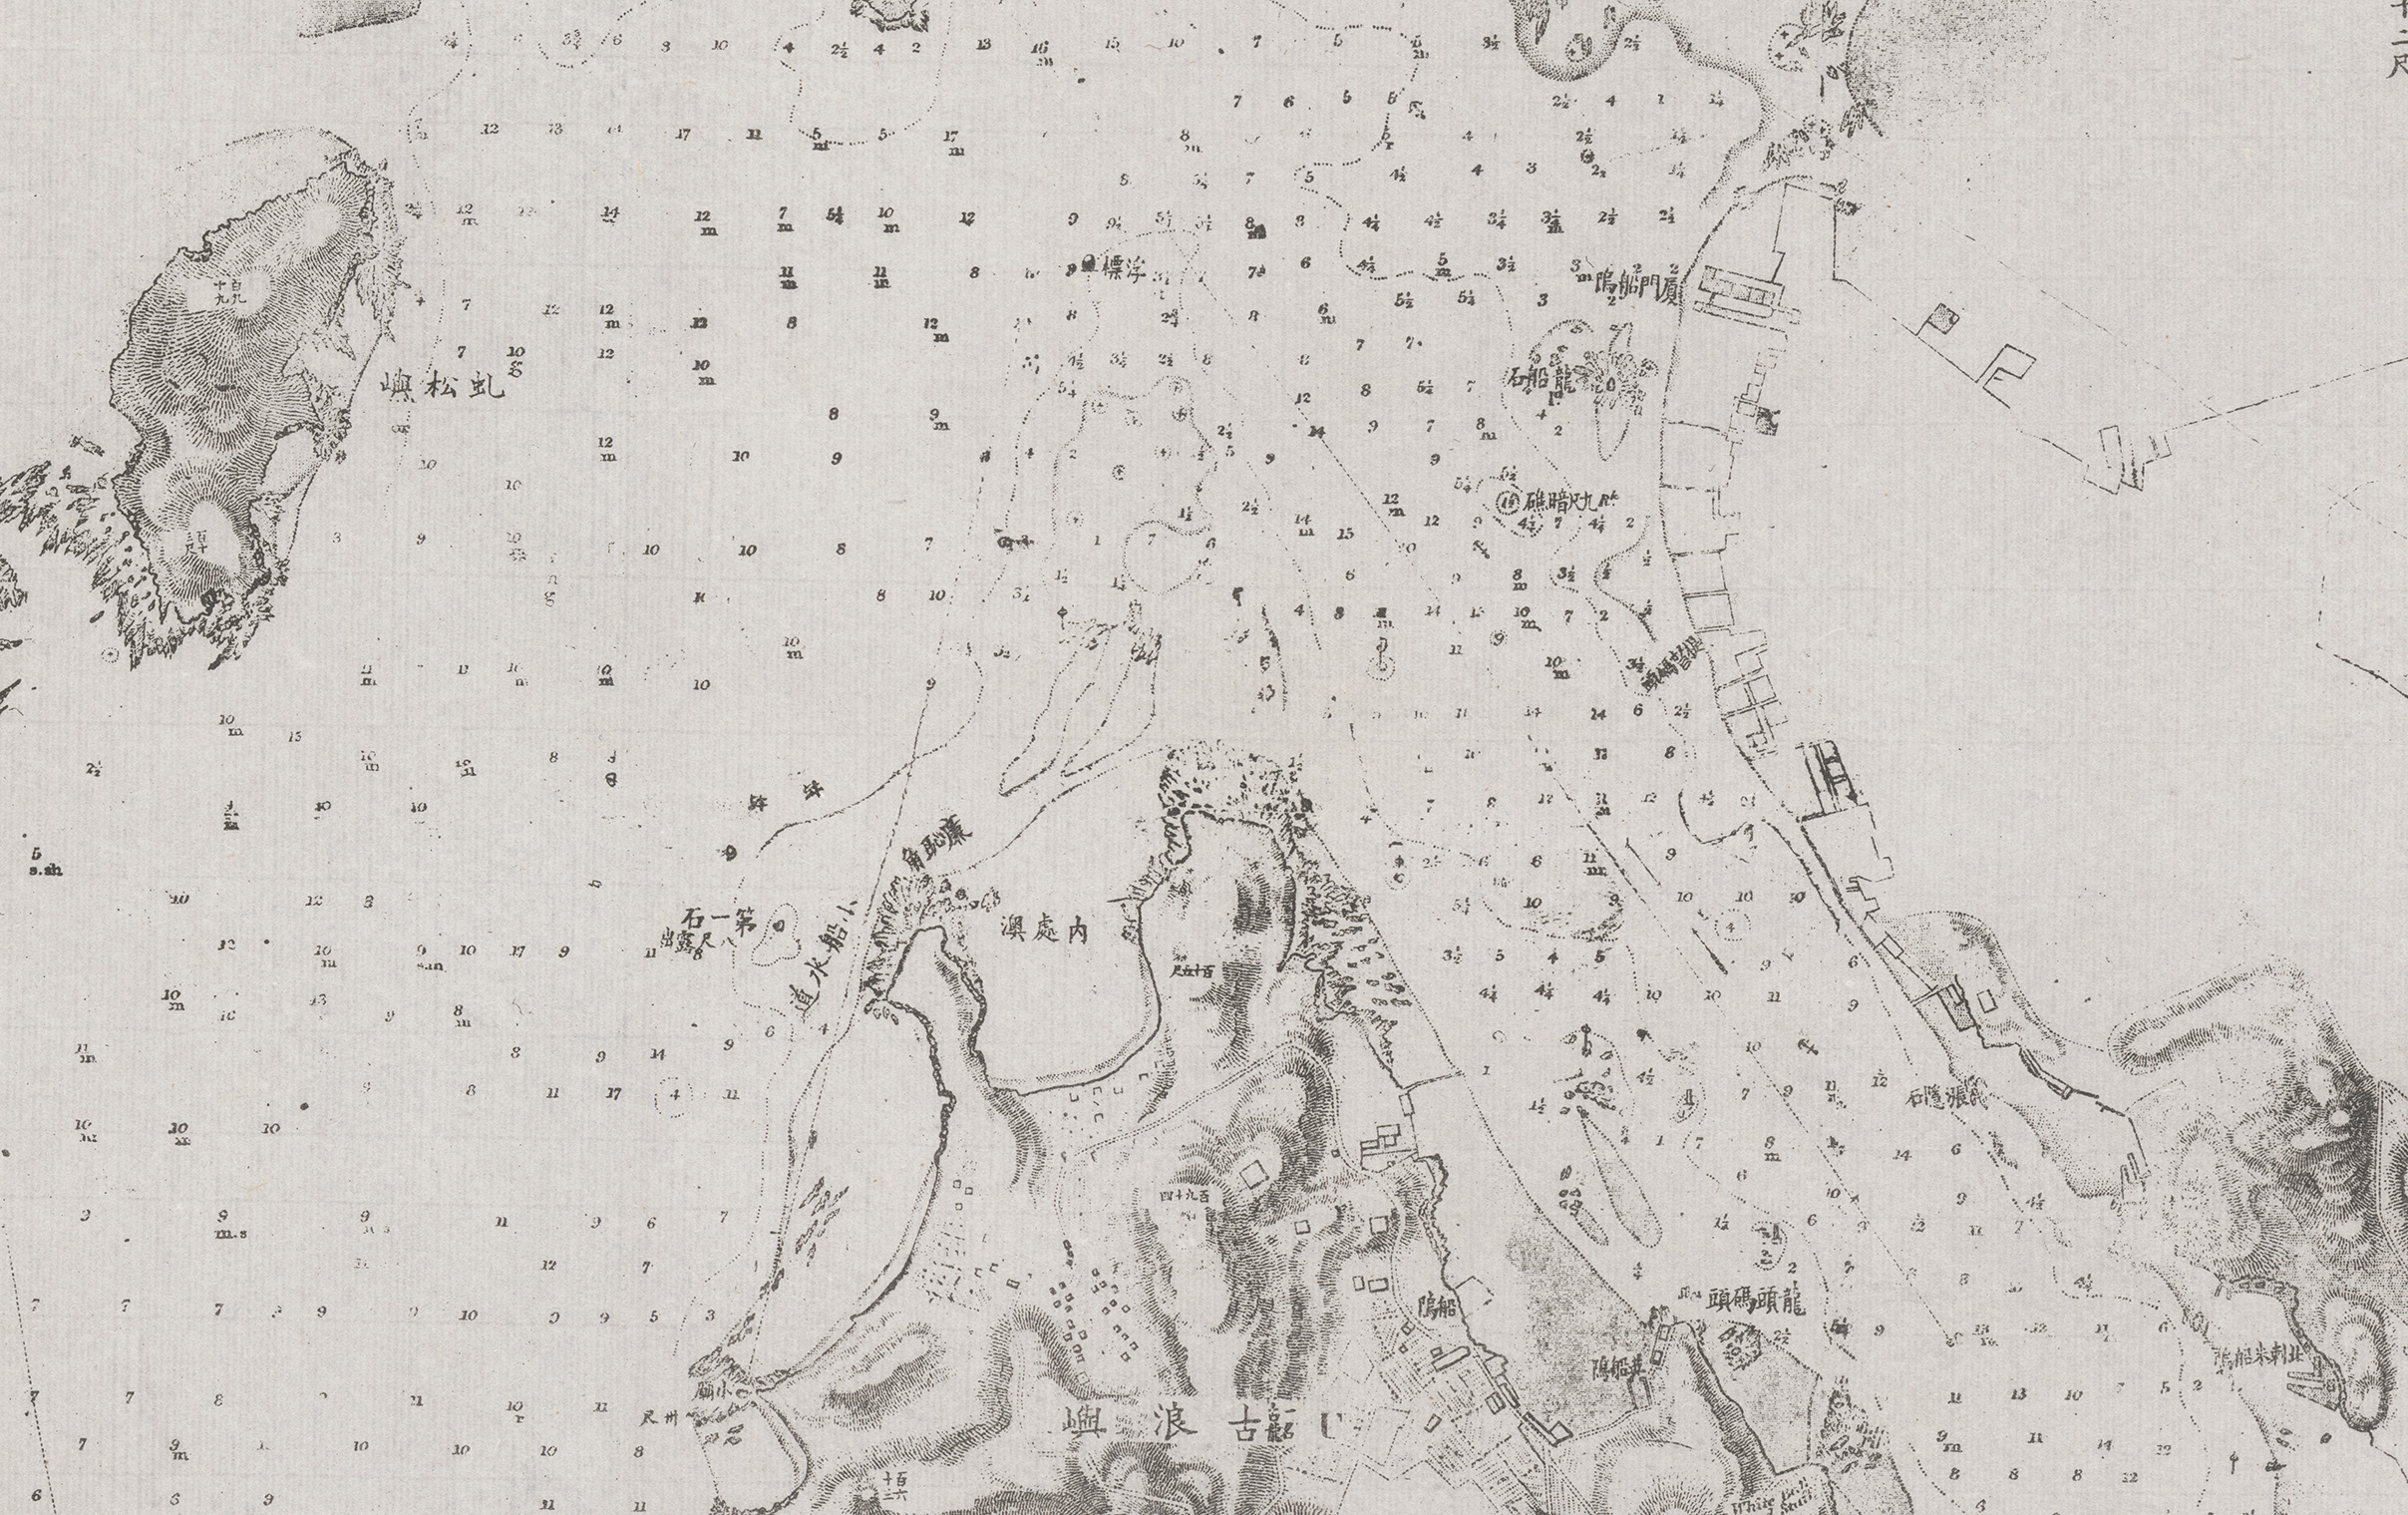
Figure A. Detail from Fujian Xiamen Neigang Shuidao 福建廈門內港水道 (Waterways of the inner harbor of Xiamen [Amoy] in Fujian province), sheet 66 from the Basheng yanhai quantu 八省沿海全圖 (Complete map of the coastline of eight provinces), ca. 1884. Based on a British chart, with a dense array of soundings.
This is fig. 205 in Iwo Amelung, “China,” in Volume 5.
Lithograph, 130 × 107 cm (entire).
Courtesy of Branner Earth Sciences Library, Stanford University Libraries (G7820 [19–?] .B3).
Hydrographic Mapping
For centuries, mariners had carefully mapped ports in detail, complete with soundings of sea depths to mark shoals and rocks that posed a danger to ships as they approached land. After 1800, hydrographic surveys extended that detailed focus to entire coastlines. Each required a careful triangulation on land (often misleadingly called “marine triangulations”) to define numerous points along a coast and around harbors (see fig. 3 in the main essay, National Topographical Surveys and “Cartography”). These control points were then used to locate the precise points on the water where surveyors in sloops or small boats took depth soundings and sampled the sea bottom, especially in harbors (fig. A) but also along coasts and around headlands (fig. B).
MHE
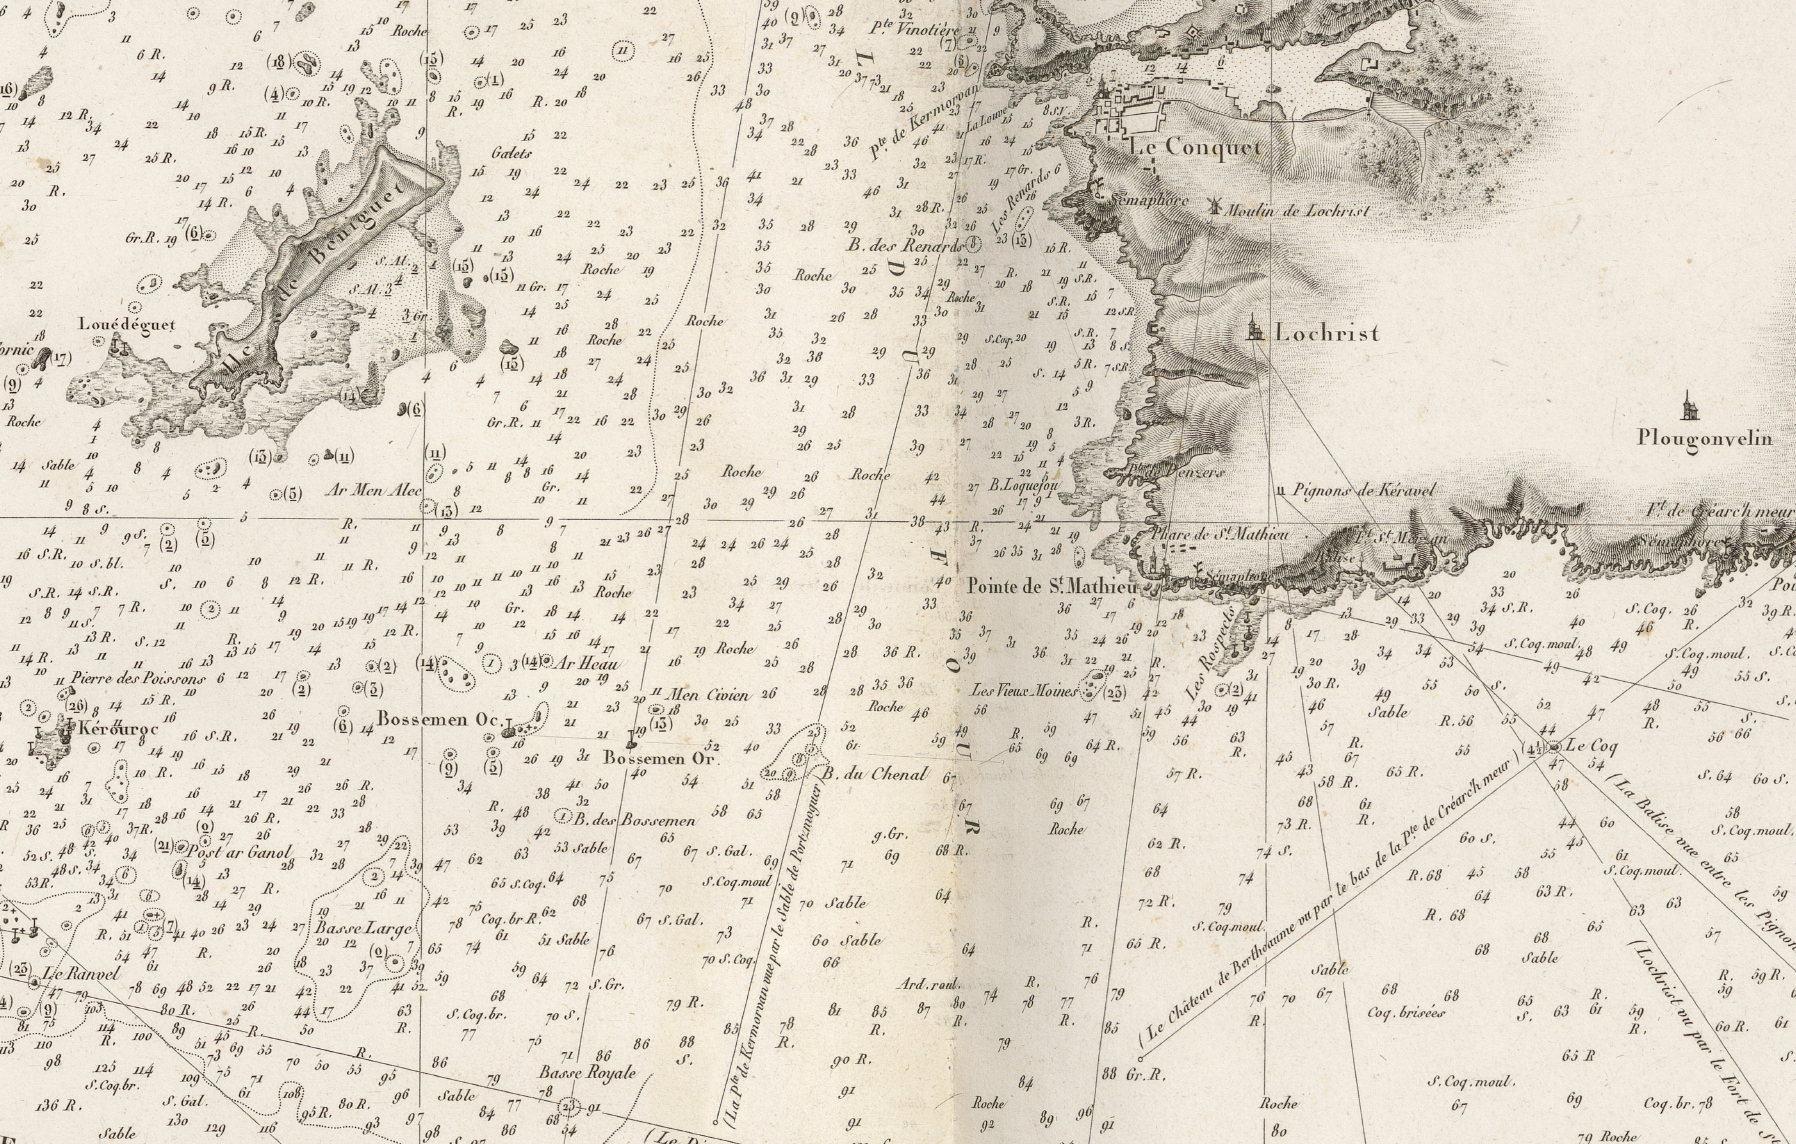
Figure B. Detail from Charles-François Beautemps-Beaupré, Carte particulière des côtes de France (Entrée de la rade de Brest et partie méridionale du Chenal du Four), from Beautemps-Beaupré, Pilote français [première partie] (Environs de Brest) ([Paris]: Dépôt Général de la Marine, 1822). In addition to the dense soundings, this chart provided information about the character of the sea floor and sightlines for use in identifying potential hazards.
This is fig. 119 in Olivier Chapuis, “Beautemps-Beaupré, Charles-François,” in Volume 5.
Copper engraving, 67 × 100 cm (entire).
Courtesy of the Bibliothèque nationale de France, Paris (Cartes et plans, Ge CC 1194); online at https://gallica.bnf.fr/ark:/12148/btv1b53198185z/f8.item.