
Publication in 2027 of Cartography in the Nineteenth Century, Volume Five of The History of Cartography, will fill the gap in the series between the eighteenth and twentieth centuries.
Metaphorically, the completed History of Cartography series offers not a road map to the subject, for the simple reason that road map implies predefined routes that must be followed, but rather a systematic and consistently structured survey of the entire intellectual terrain of maps and mapping across the centuries. Armed with this comprehensive and detailed map, students will be able to create their own routes across and through cartography. Students will be able to pick out and develop new insights and interpretations; they do not have to just continue along established routes, no matter how productive these might be, but they can follow new paths, perhaps turning them into major routes. In particular, students will be able to construct new narratives of how particular kinds of mapping practices have changed over time. It seems appropriate to demonstrate this new historiographical ability with respect to one of the core nineteenth-century innovations in cartography: systematic topographical surveys.
Visit 2025 Outreach Extras to find links to accompanying materials.
Please consider contributing your support to the comprehensive work of the History of Cartography Project – click “Make A Gift” at right to donate online!
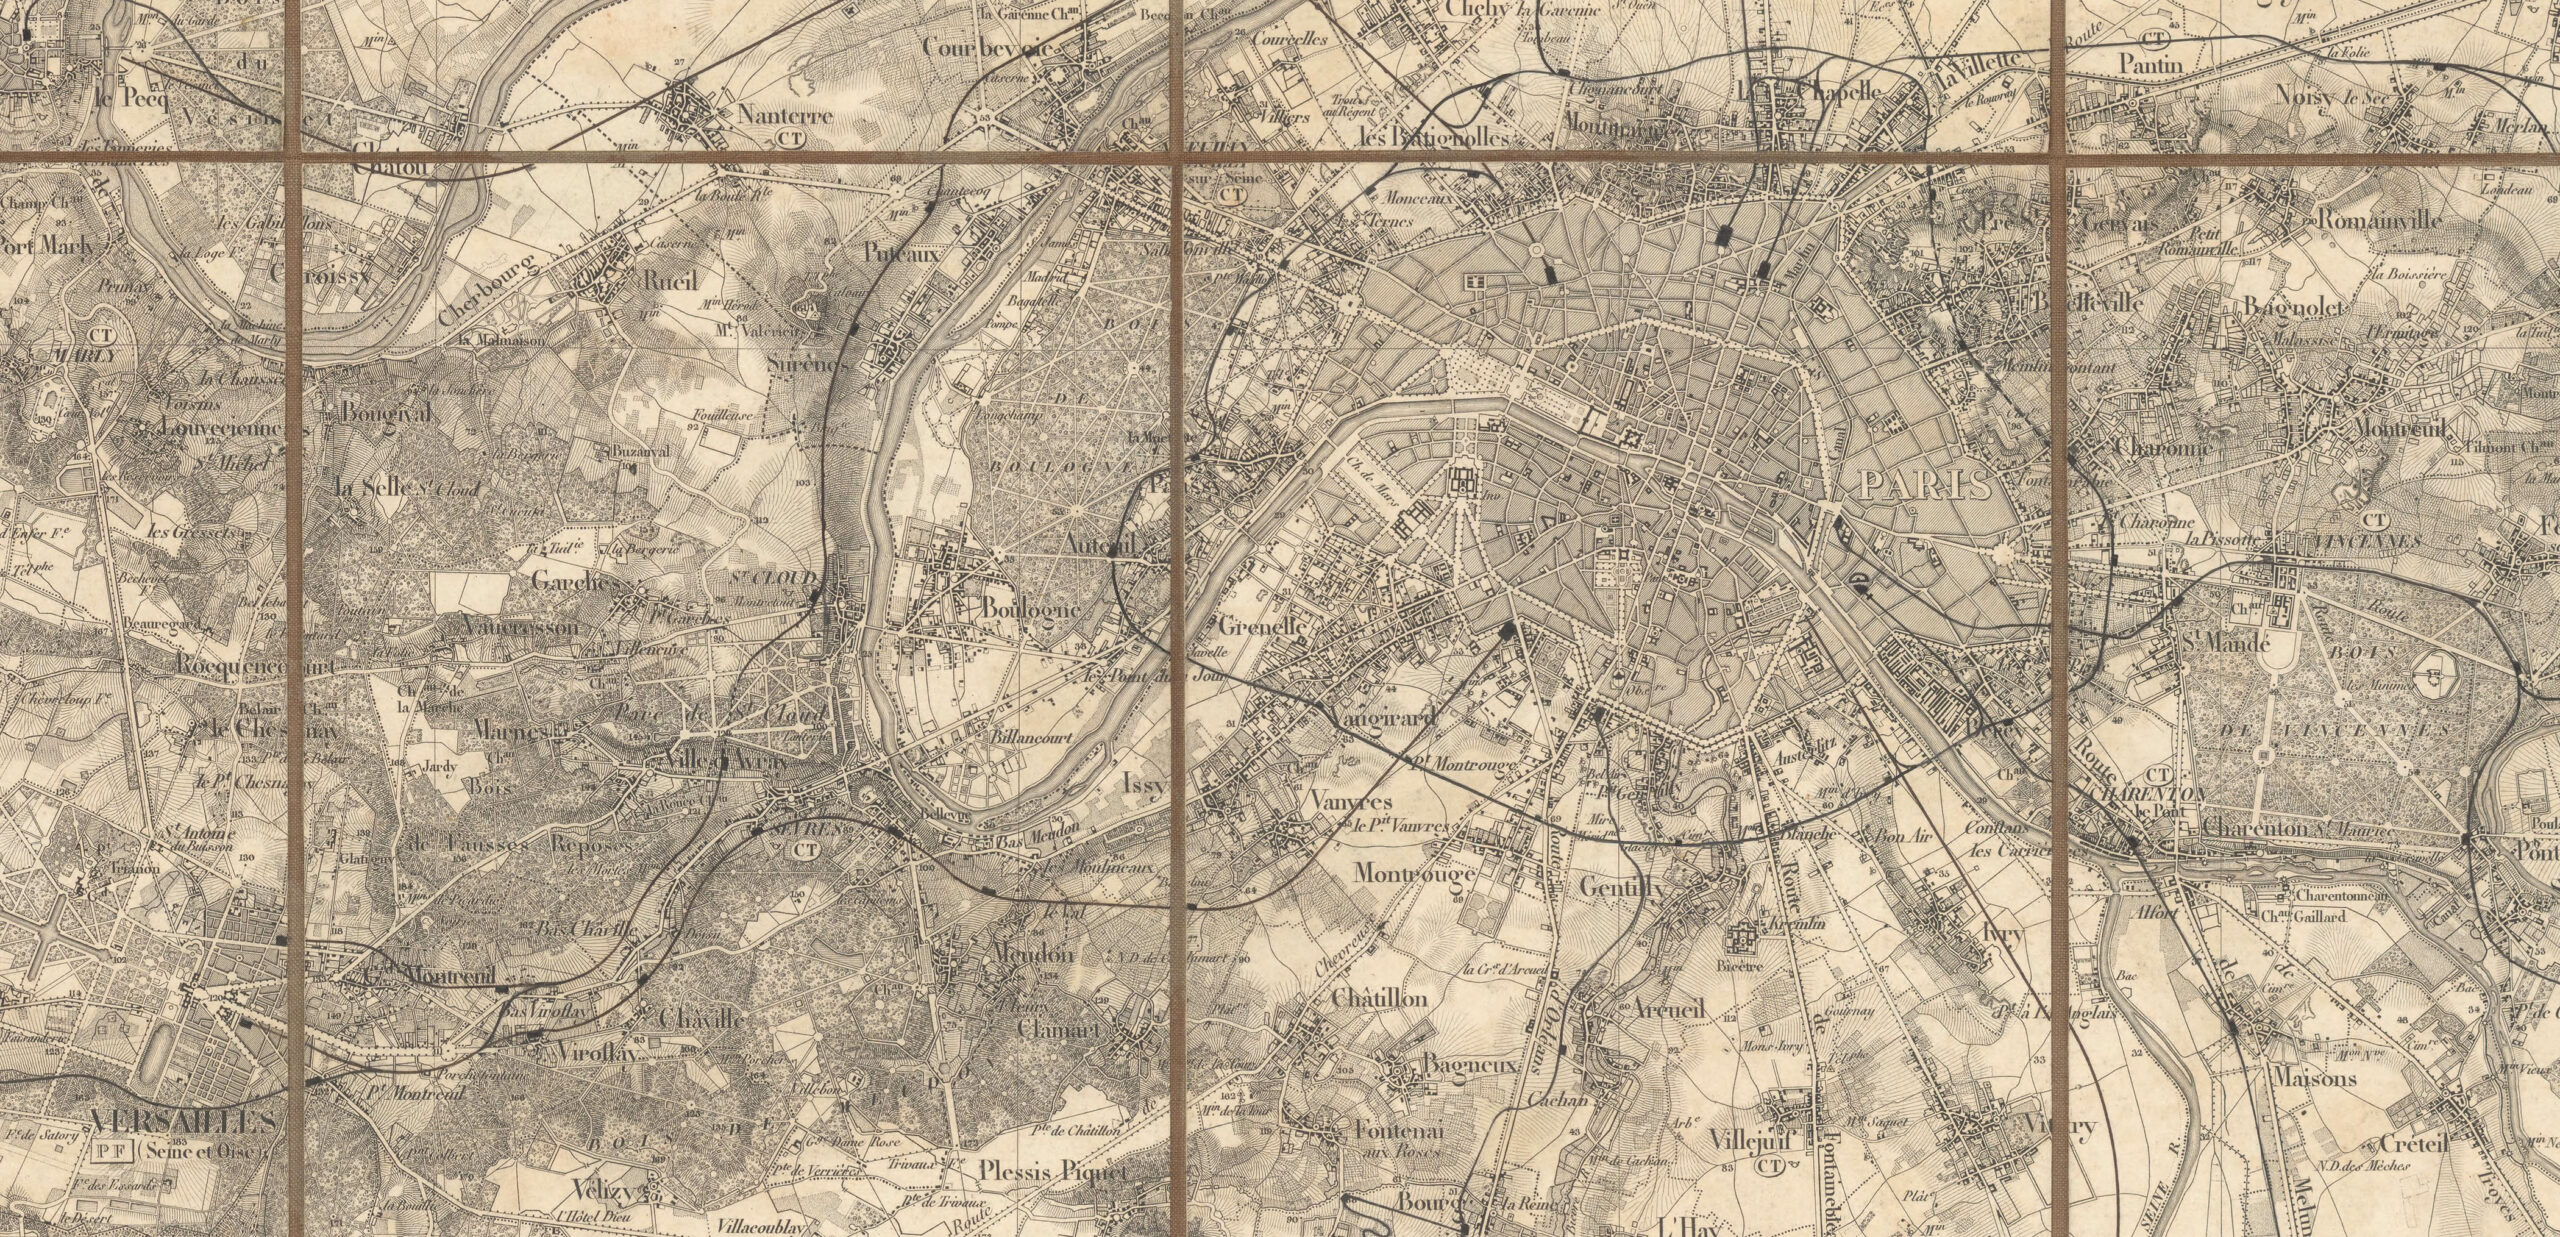
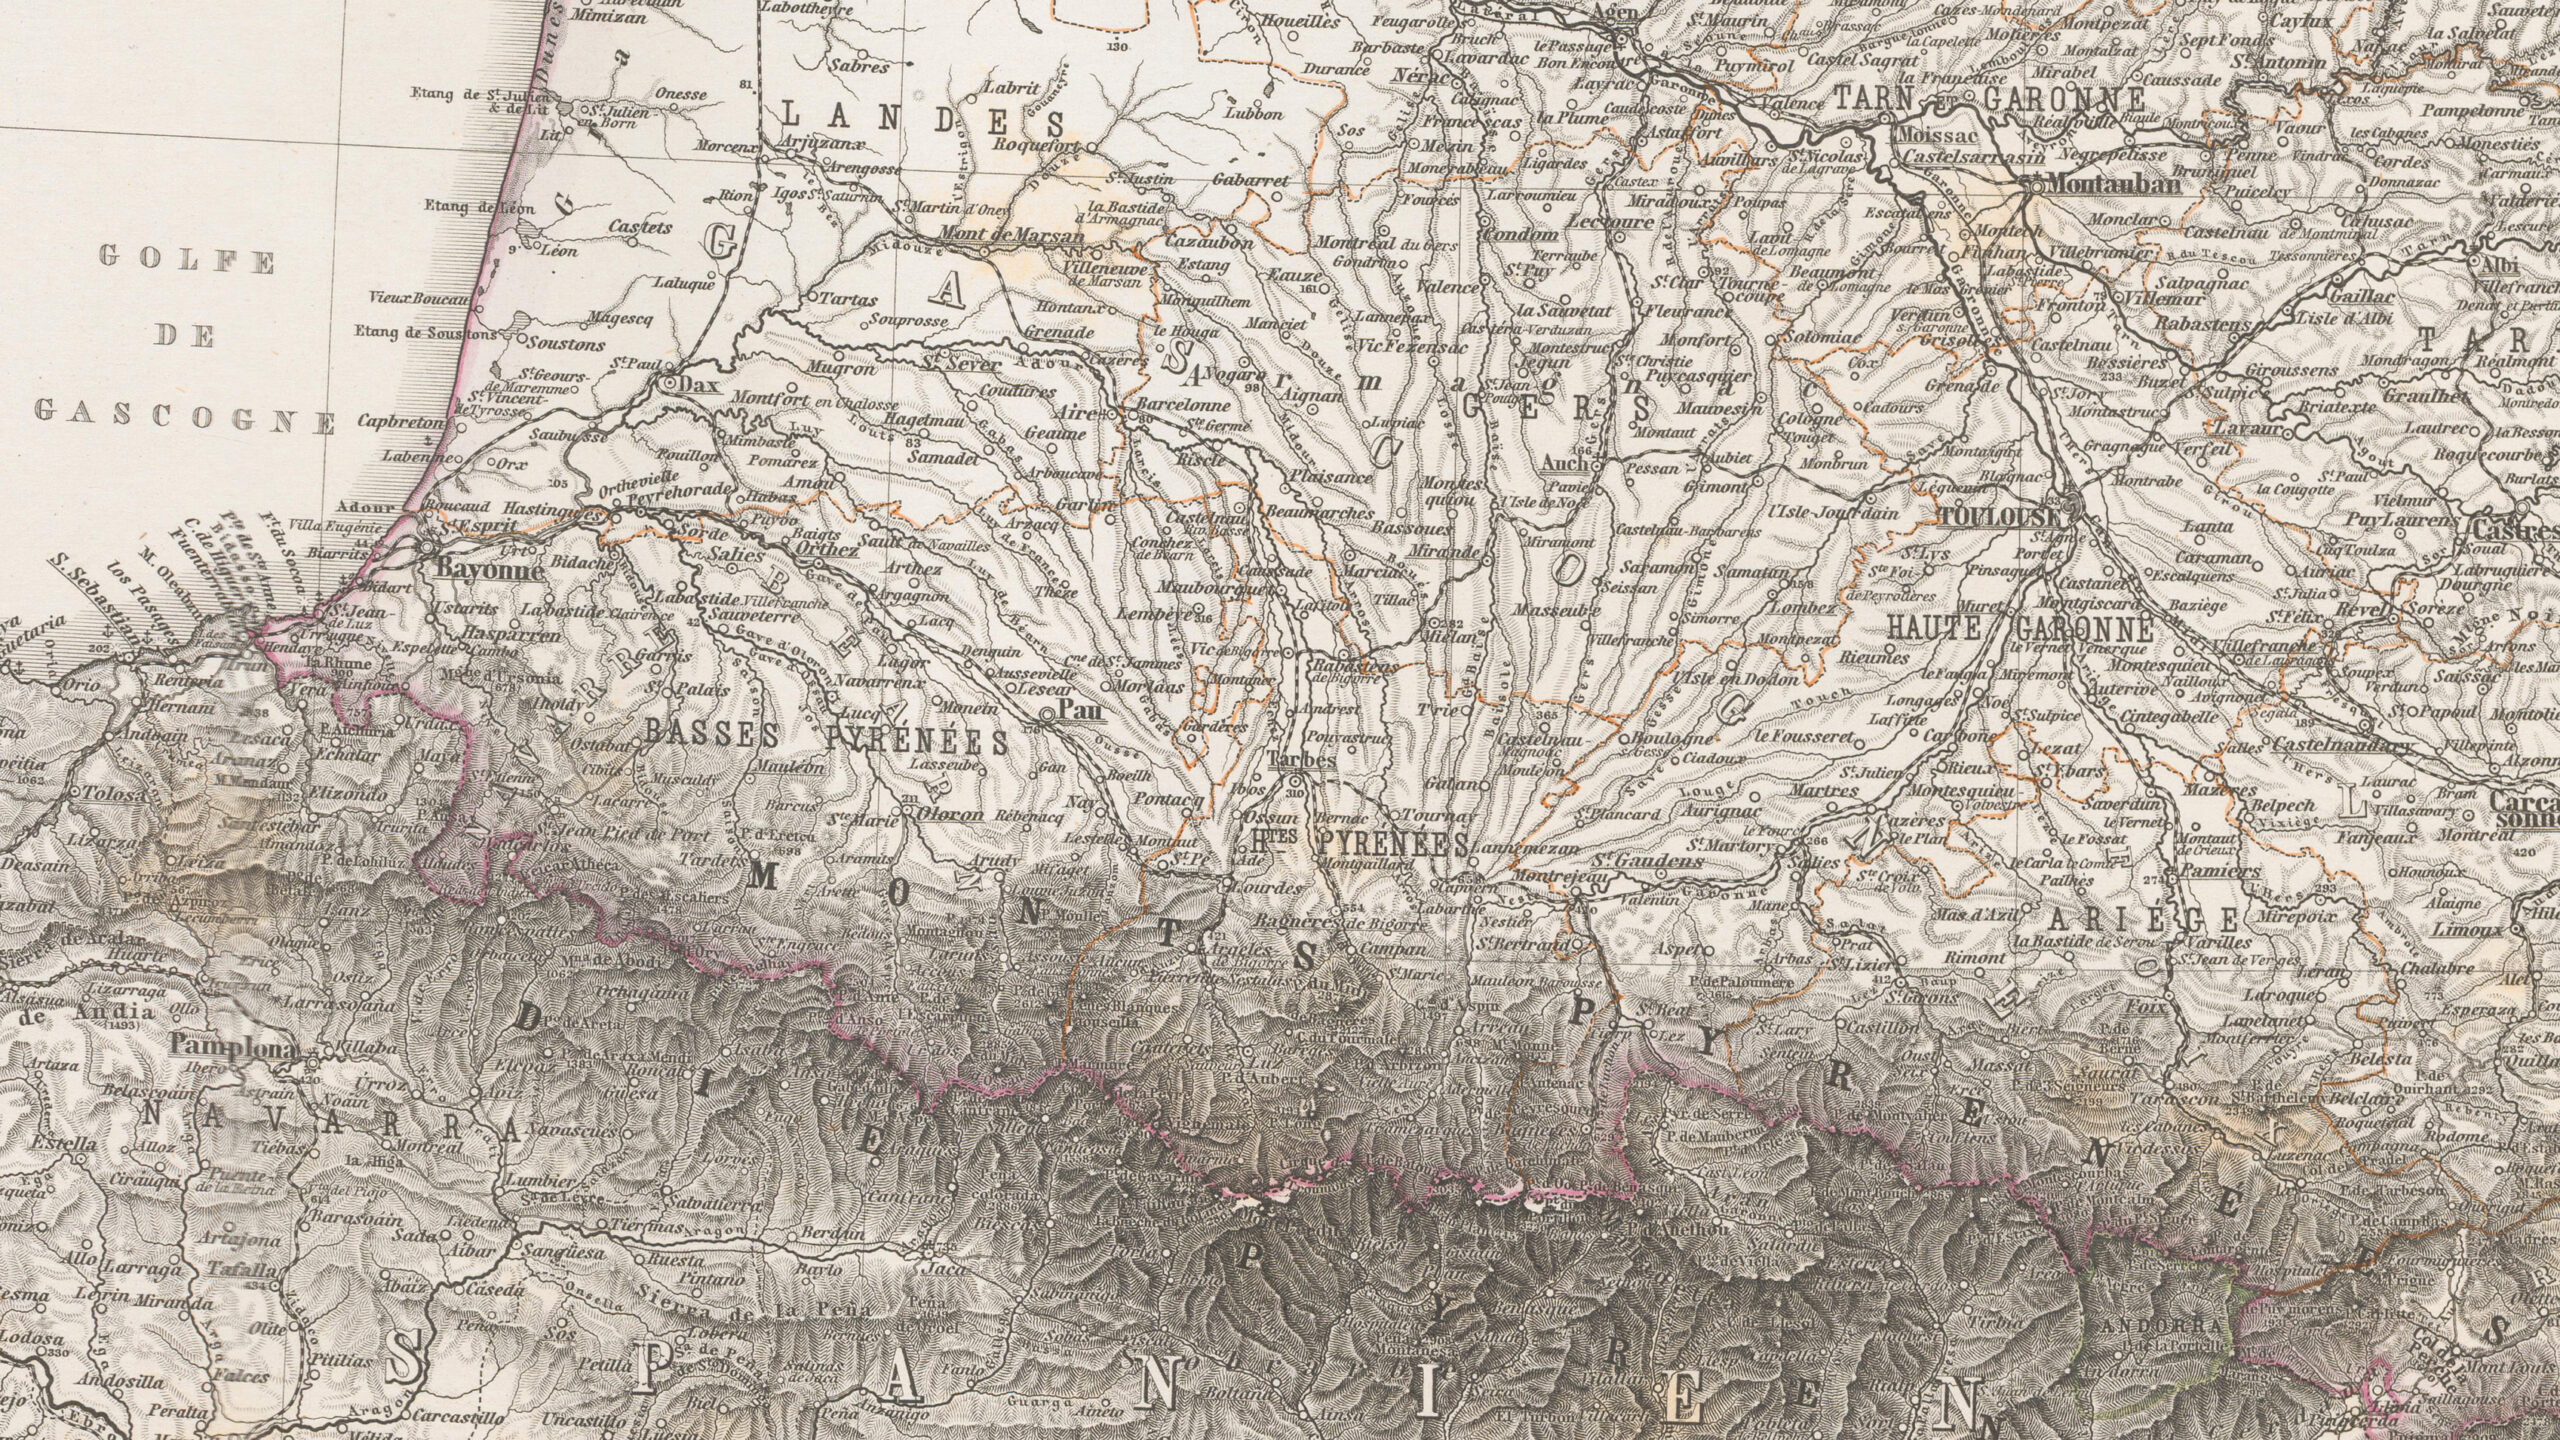
Figure 1. Detail from Paris, 1:80,000, sheet 48 of the carte de l’État-major (Paris: Service géographique de l’armée, 1832), with railroad lines added later in manuscript. Copper engraving, dissected onto cloth, 57 × 88 cm (entire).
Courtesy of Cartography Associates (16036.050); online at davidrumsey.com.
Systematic territorial surveys, each covering a country at a large scale and in hundreds of sheets, are a hallmark of modern cartography. Detailed topographical maps such as that of Paris and its surrounding countryside in figure 1 above—just one sheet of the 273 that covered all of France at 1:80,000 in the carte de l’État-major (map of the general staff)—showed hills and escarpments, parklands and urban areas, quarries and mills, small villages and isolated hamlets, farms and forests, moorlands and mountains, rivers and streams, mud flats and lakes, all named and divided into districts and provinces. Such maps were widely consumed by civil and military officials and by the public as well. The names of the surveys that produced the topographical maps are well-known to map historians: the Ordnance Survey in Britain; the U.S. Geological Survey; the Service géographique de l’armée in France, which made the map in figure 1; the Instituto geografico militare in Italy; the Survey of India; and many more.
Much has been written about individual national surveys, whether technical and progress reports issued by superintendents and directors, official histories prepared by senior or retired surveyors, or academic studies by map historians. The history of the national surveys as a whole, however, has been a feature of only a few studies. In English, we must look to Lloyd Brown’s triumphalist The Story of Maps (Boston, 1949), which culminated in the imminent achievement of the complete (re)surveying of the entire globe after World War II, and to John Noble Wilford’s highly derivative The Mapmakers (New York, 1981, and reprinted most recently in 2016). These accounts significantly smoothed over and adjusted the history of national surveys into an almost inevitable sequence of cartographic progress. Brown identified the first systematic surveys in each European country—beginning with the pioneering survey of France (1747–93) directed by César-François Cassini [III] de Thury and then Jean-Dominique Cassini [IV], which of course features prominently in Volume Four of The History of Cartography (fig. 2)—but did not then detail any subsequent surveys, suggesting that those very first systematic surveys had fixed the institutional character of topographical mapping in each country, into the present day.
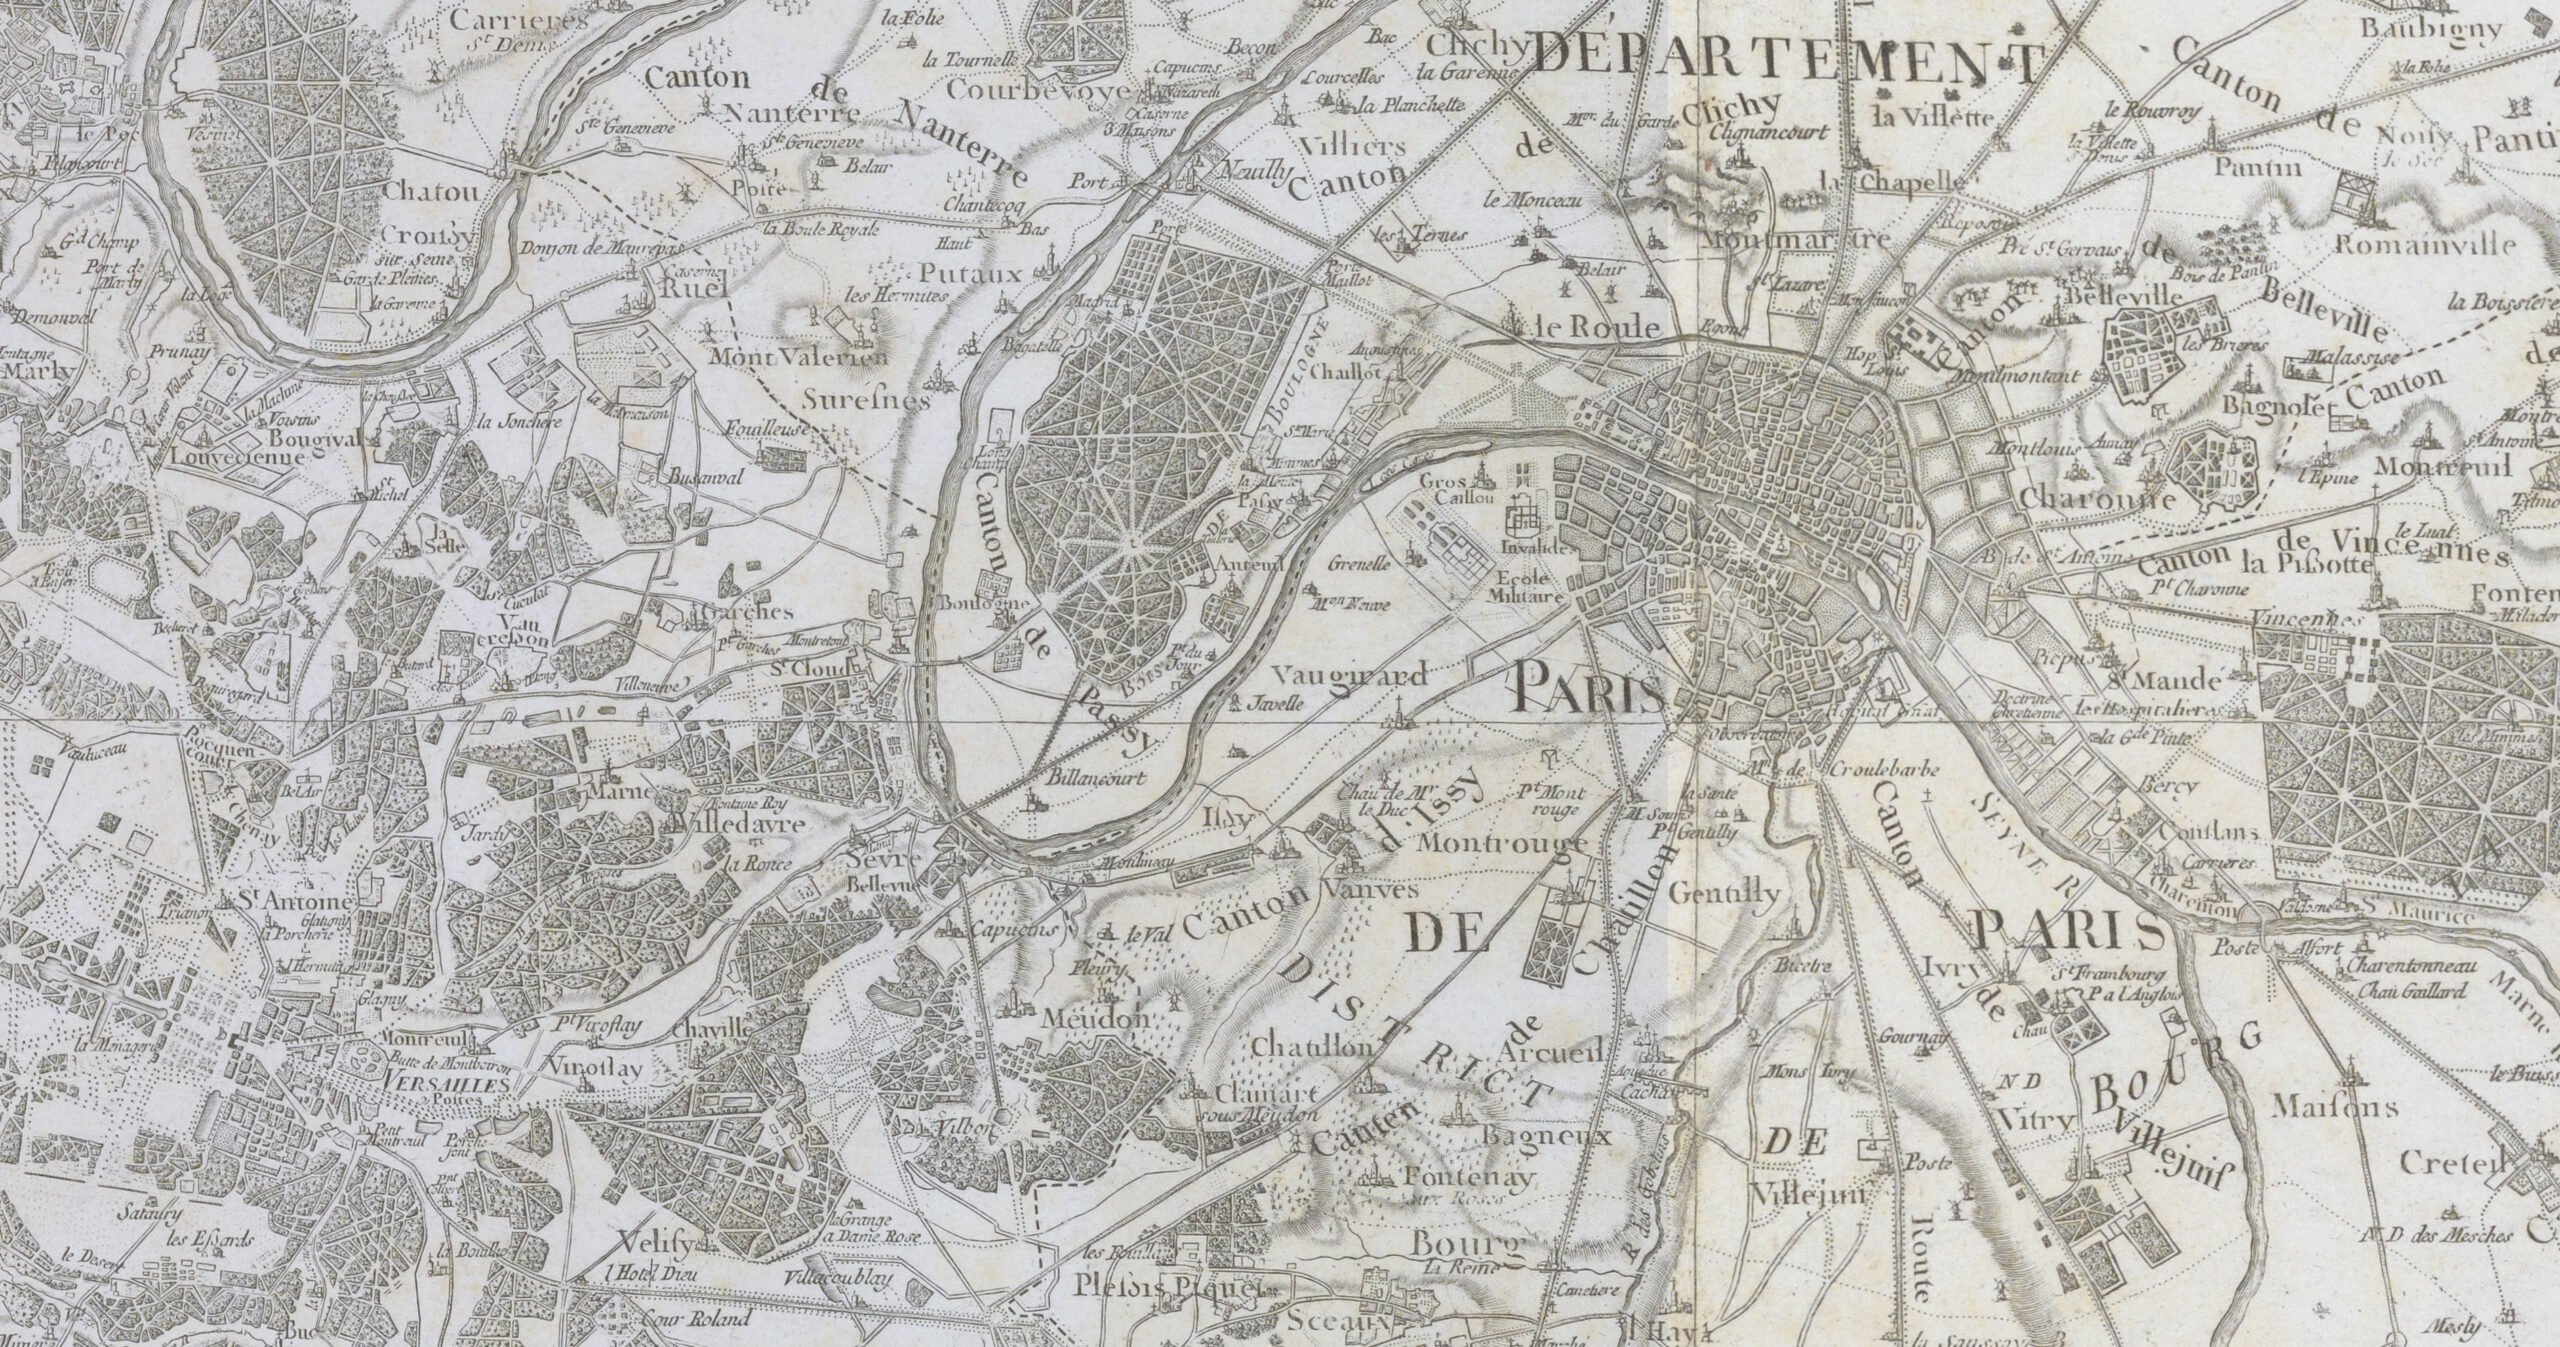
Copper engraving.
Courtesy of the Osher Map Library and Smith Center for Cartographic Education, University of Southern Maine (Osher Collection); online at http://oshermaps.org/map/865.0014c.
Yet anyone who has had any experience with large government organizations knows that nothing about them is ever smooth or consistent! The entries in Volume Five on topographical mapping within national contexts, on particular survey institutions, and on key individuals together provide much information and allow a more nuanced and more human history of the phenomenon.
For example, Nicolas Verdier, in his entry in Volume Five on “Topographical Mapping in France,” makes it plain that the nineteenth-century mapping of France—the so-called carte de l’État-major—was an endeavor distinct from that of the Cassinis in the previous century. Indeed, the military, who undertook the new work, had long disparaged the Cassinis’ maps for their inadequate portrayal of relief. The new work began in 1820 with a complete resurvey of the primary and secondary triangulations of France, which would be completed only in 1855 (fig. 3). The dependent topographical surveys could not begin until each major section of the triangulation was finished, so the survey’s first map sheets were not issued until 1832 (fig. 1); the last of the survey’s 273 sheets appeared in 1880. Until this very late date, the only topographical maps available for the southwest of France were the well-worn, century-old sheets produced by the Cassinis. (Read a short accompanying essay for more illustrations and information about triangulation.)
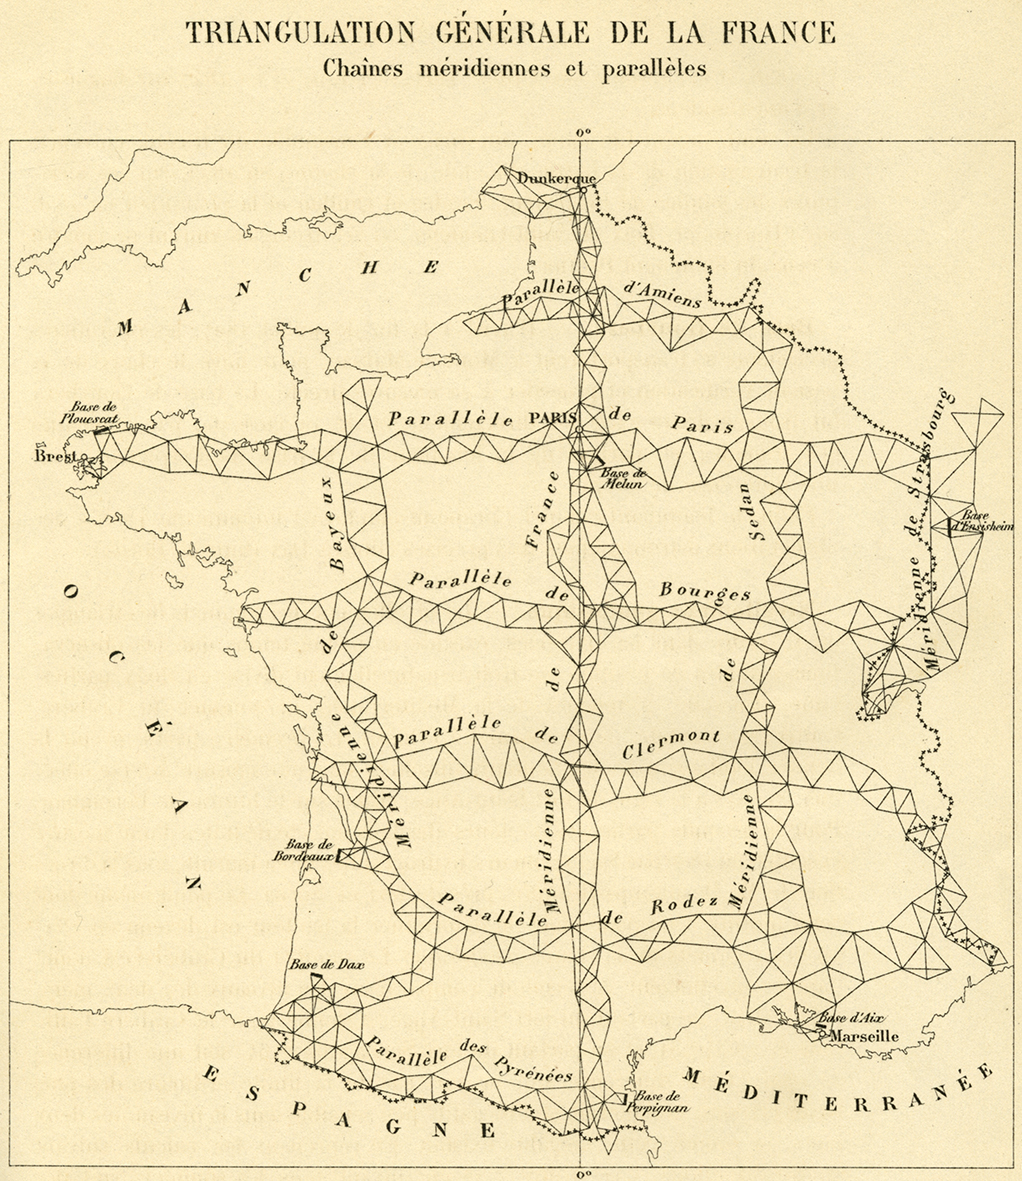
Figure 3. Triangulation générale de la France: Chaînes méridiennes et parallèles, in Henri-Marie-Auguste Berthaut, La carte de France, 1750–1898: Étude historique, 2 vols. (Paris: Imprimerie du service géographique de l’armée, 1898–99), vol. 2, following 24.
This is fig. 314 in Michael Kershaw, “Geodetic Surveying in France,” in Volume 5.
Lithograph, 18.2 × 15.9 cm.
Appeal of Systematic, Territorial Surveys
There was a major change in attitude in about 1800. Eighteenth-century regional surveys were all very much works undertaken for specific purposes or communities of users. Now, however, administrators in several countries were greatly excited by the idea of systematic surveys that were properly grounded in a rigorous triangulation, because it seemed that one survey would be able to meet all of the state’s needs. Each survey would still be a self-contained endeavor, in that it would be closed down once complete, but it would nonetheless meet the state’s military, cadastral, hydrographic, geological, and other needs.
As I discuss in my entry in Volume Five on “Cartography,” the commission appointed in 1817 to determine how to remap France had begun its deliberations with such a singular survey in mind. The technological exuberance was soon tamed by financial considerations: it would have been prohibitively expensive to undertake a combined topographical and cadastral survey. In the end, only a new military topographical survey was pursued; moreover, the commissioners shrank the number of map sheets and the survey’s overall cost by reducing the scale from the initially proposed 1:50,000. Without a new survey for regulating taxation, the cadastral survey established by Napoléon in 1807 was allowed to continue unaltered, with the recording of property ownership and the mapping of property parcels at 1:2,500 being undertaken separately for each commune (see Roger Kain’s entry on “Property Mapping in France”).
The Bavarians were as exuberant as the French, and with a much smaller territory to be covered they were able to coordinate the cadastral and topographical surveys. Grounded on the same triangulation, a cadastral commission and a military topographical bureau respectively mapped Bavarian properties in manuscript at 1:2,500 or 1:5,000, with some sheets being reproduced lithographically, and the country’s topography at 1:50,000, printed from copper plates (fig. 4).
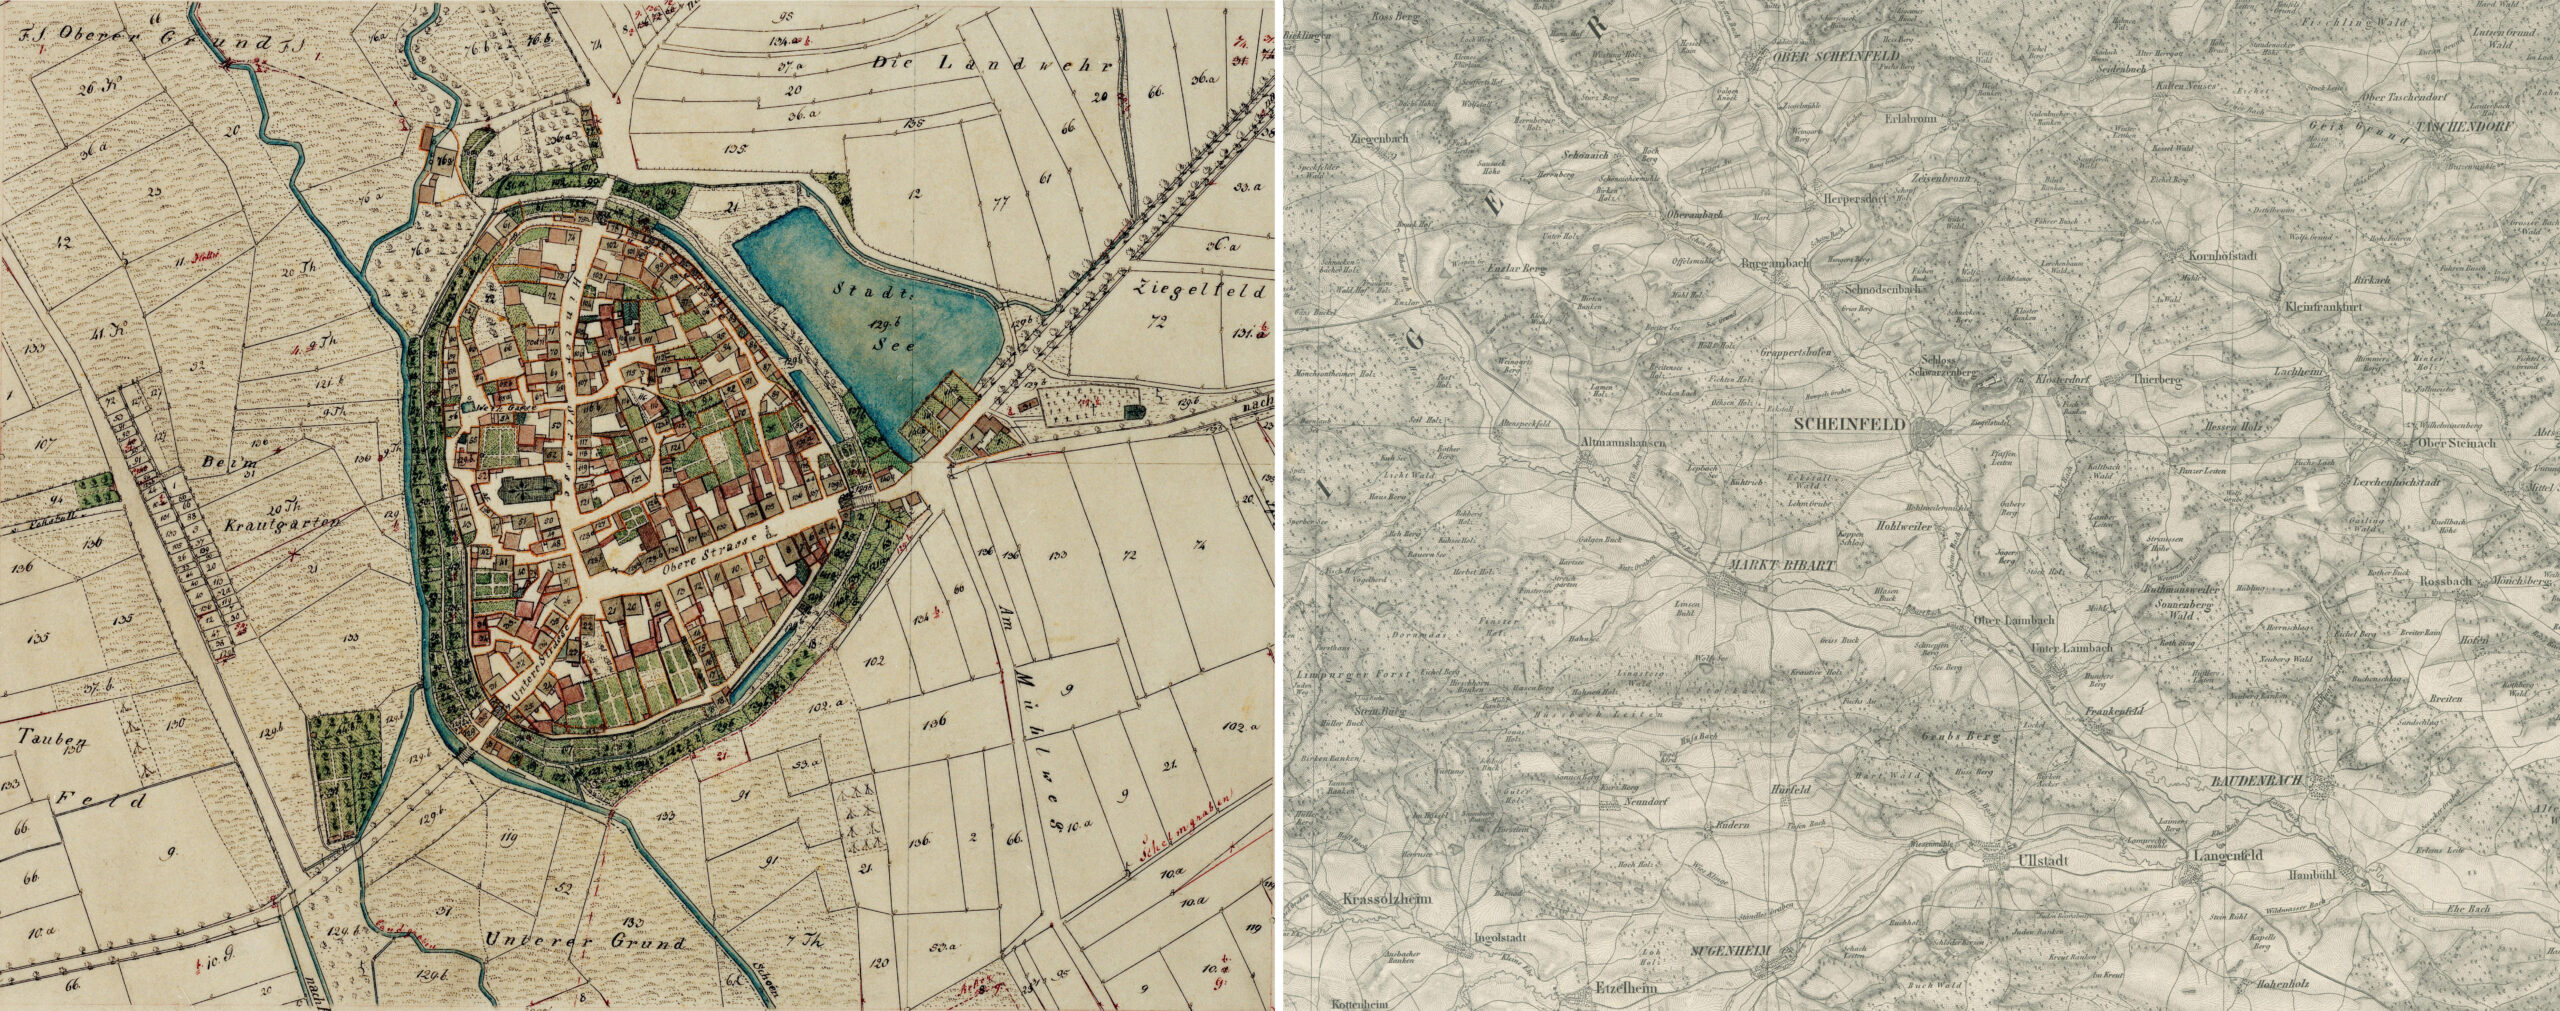
Left: detail from the manuscript “Stadt Scheinfeld mit 153 Numern gemessen von Anton Neubauer” (1828), at 1:5,000, sheet 36 of the Bavarian cadastre.
This is fig. 622 in Elizabeth Baigent, “Property Mapping in the German States,” in Volume 5.
Courtesy of Bayerische Vermessungsverwaltung, Landesamt für Digitalisierung, Breitband und Vermessung, Munich (Uraufnahme Scheinfeld 1828).
Right: detail from Friedrich Kappel and Otto Messerer, Scheinfeld, 1:50,000, from Topographischer Atlas vom Königreiche Baiern, sheet 27 (1855).
Copper engraving.
Courtesy of the Bayerische Staatsbibliothek (Mapp. XI,57 du-27); online at https://www.digitale-sammlungen.de/en/view/bsb00011130.
As politicians and bureaucrats in London discussed the need to map Ireland, they too thought in terms of one survey to meet all needs. In 1819, the secretary to the Admiralty, J. W. Croker, proposed a single geographical, hydrographic, and statistical survey. The same desire permeated the evidence submitted to the Spring-Rice parliamentary committee, whose final report of 21 June 1824 established the broad parameters of the Ordnance Survey of Ireland (OSI); the commission’s members and witnesses variously suggested a single survey for the military, a field-by-field cadastral survey, a hydrographic survey of the coasts, and a geological survey of mineral resources (especially of coal and ceramic clays). The final survey featured a combined military and cadastral survey, but the latter was accomplished at 1:10,560 or six inches to one mile—which is relatively small for cadastral work—because the British needed to survey only the “townlands” owned by Anglo-Irish landlords rather than individual parcels of land (fig. 5). As with the Bavarian surveys, the OSI featured two main components, one to map the landscape, the other to ascertain ownership and other cultural aspects of each community.
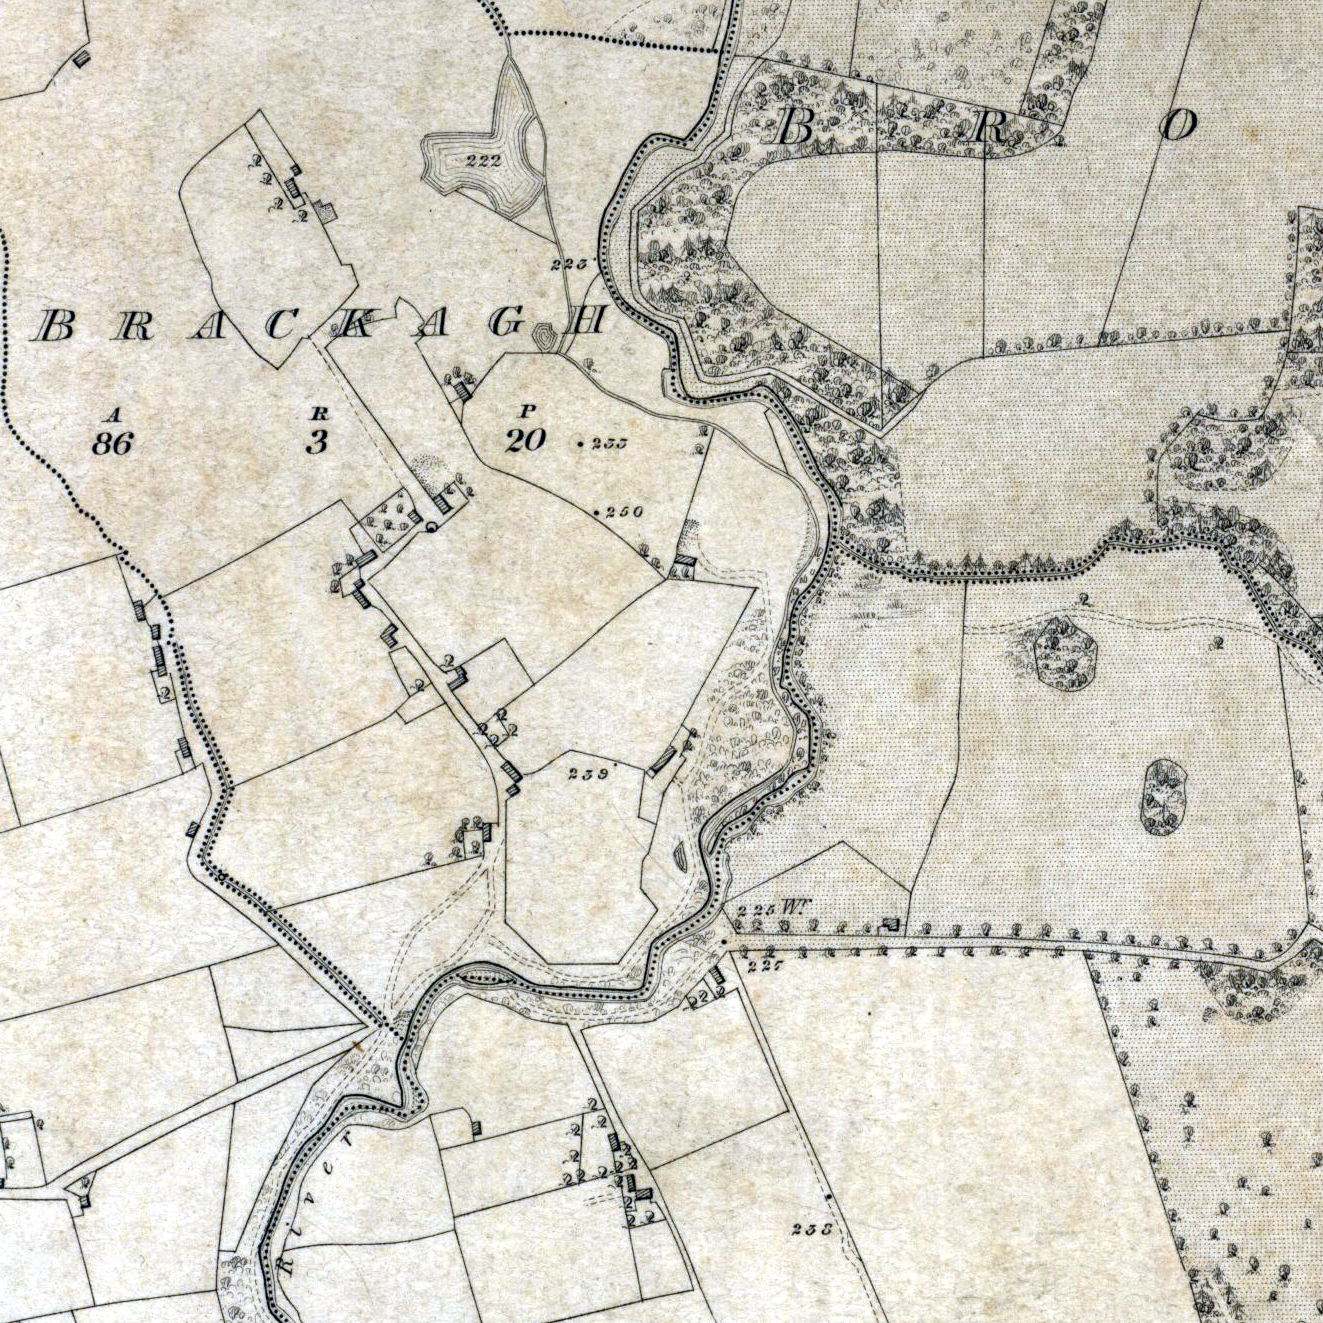
Figure 5. Detail from King’s County (County Offaly), Sheet 24, at 1:10,560 (surveyed 1838), by the Ordnance Survey of Ireland.
This is fig. 578 in Richard Oliver, “Ordnance Survey (Great Britain),” in Volume 5.
Copper engraving, 8.4 × 8.4 cm (detail).
Courtesy of Richard Oliver.
The full image can be consulted online at https://maps.nls.uk/view/246837721.
Real Achievement of System
In practice, the different concerns of different portions of modern bureaucracies required different mapping methodologies—it was simply not feasible for one survey to do it all. Both hydrographic and topographical surveys for example, were based on high-quality primary triangulations, but they began to diverge in their secondary triangulations. For topographical surveys, the secondary triangles had to cover wide areas with a fairly dense array of control points, but for hydrographic surveys, the lesser triangles were all focused on defining control points along coastlines (fig. 6). Hydrographic surveys also required the deployment of a variety of inshore and ocean-going vessels, which might be borrowed from navies or might be owned and operated by the survey agencies themselves. Still other kinds of systematic surveys—geological, linguistic, cadastral—were pursued by other parts of government. (See our short accompanying supplement on hydrographic mapping.)
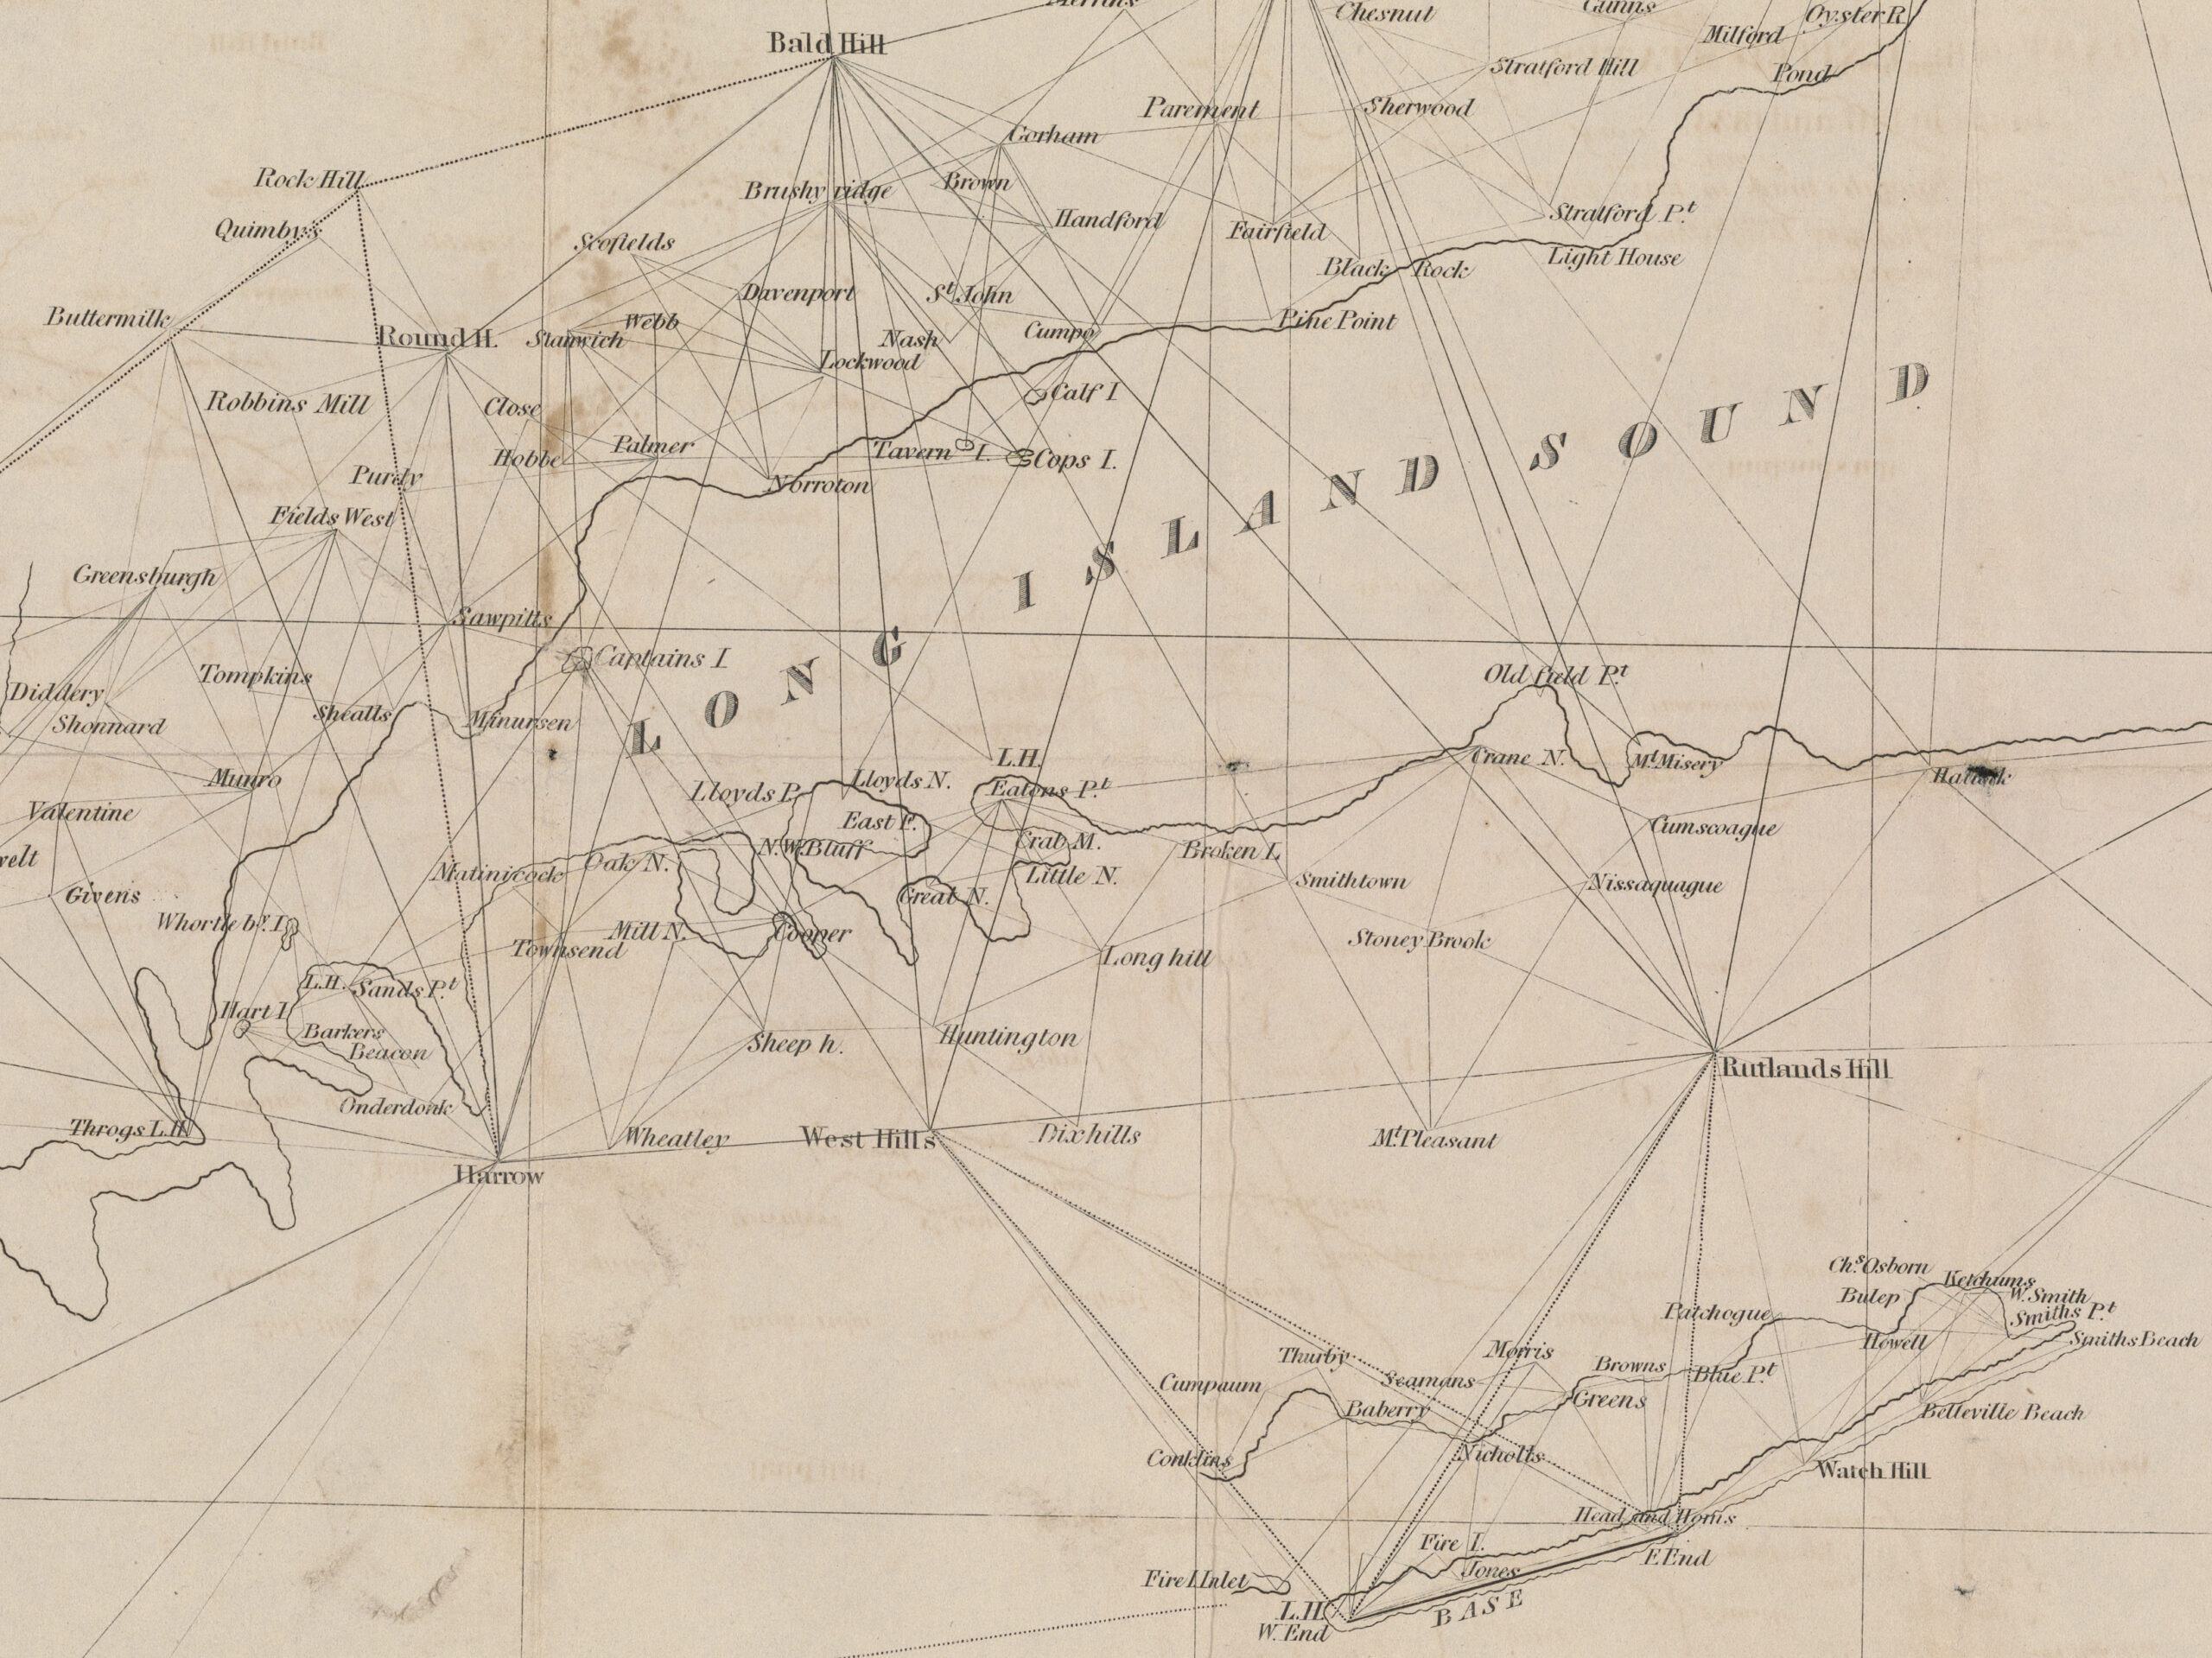
Copper engraving, 35 × 47 cm.
Courtesy of the Osher Map Library and Smith Center for Cartographic Education, University of Southern Maine (Osher Map Library Collections); online at https://oshermaps.org/map/45813.0001.
National topographical surveys took a long time to do correctly, but when done right they attracted the approval of the government officials who used them. As agricultural and industrial reforms increasingly changed the landscapes and cityscapes of Europe, governments came to rely on the military surveys to provide ever more detailed information to aid planning and governance (fig. 7). The surveys became integral elements of government, with permanent employees no longer at risk of being called back to active service, and more importantly with permanent budgets. Politicians ceased questioning the basic need for territorial surveys, although the need for efficiency and to protect against wasteful spending always persisted; this achievement is apparent in Scott Kirsch’s entry on the “Allison Commission (U.S.),” which exhaustively reviewed the work of the U.S. Geological Survey and the U.S. Coast and Geodetic Survey in 1884. In this respect, territorial surveys became a persistent feature of every country in Europe and in many of Europe’s colonies, as Volume Five explores in detail.
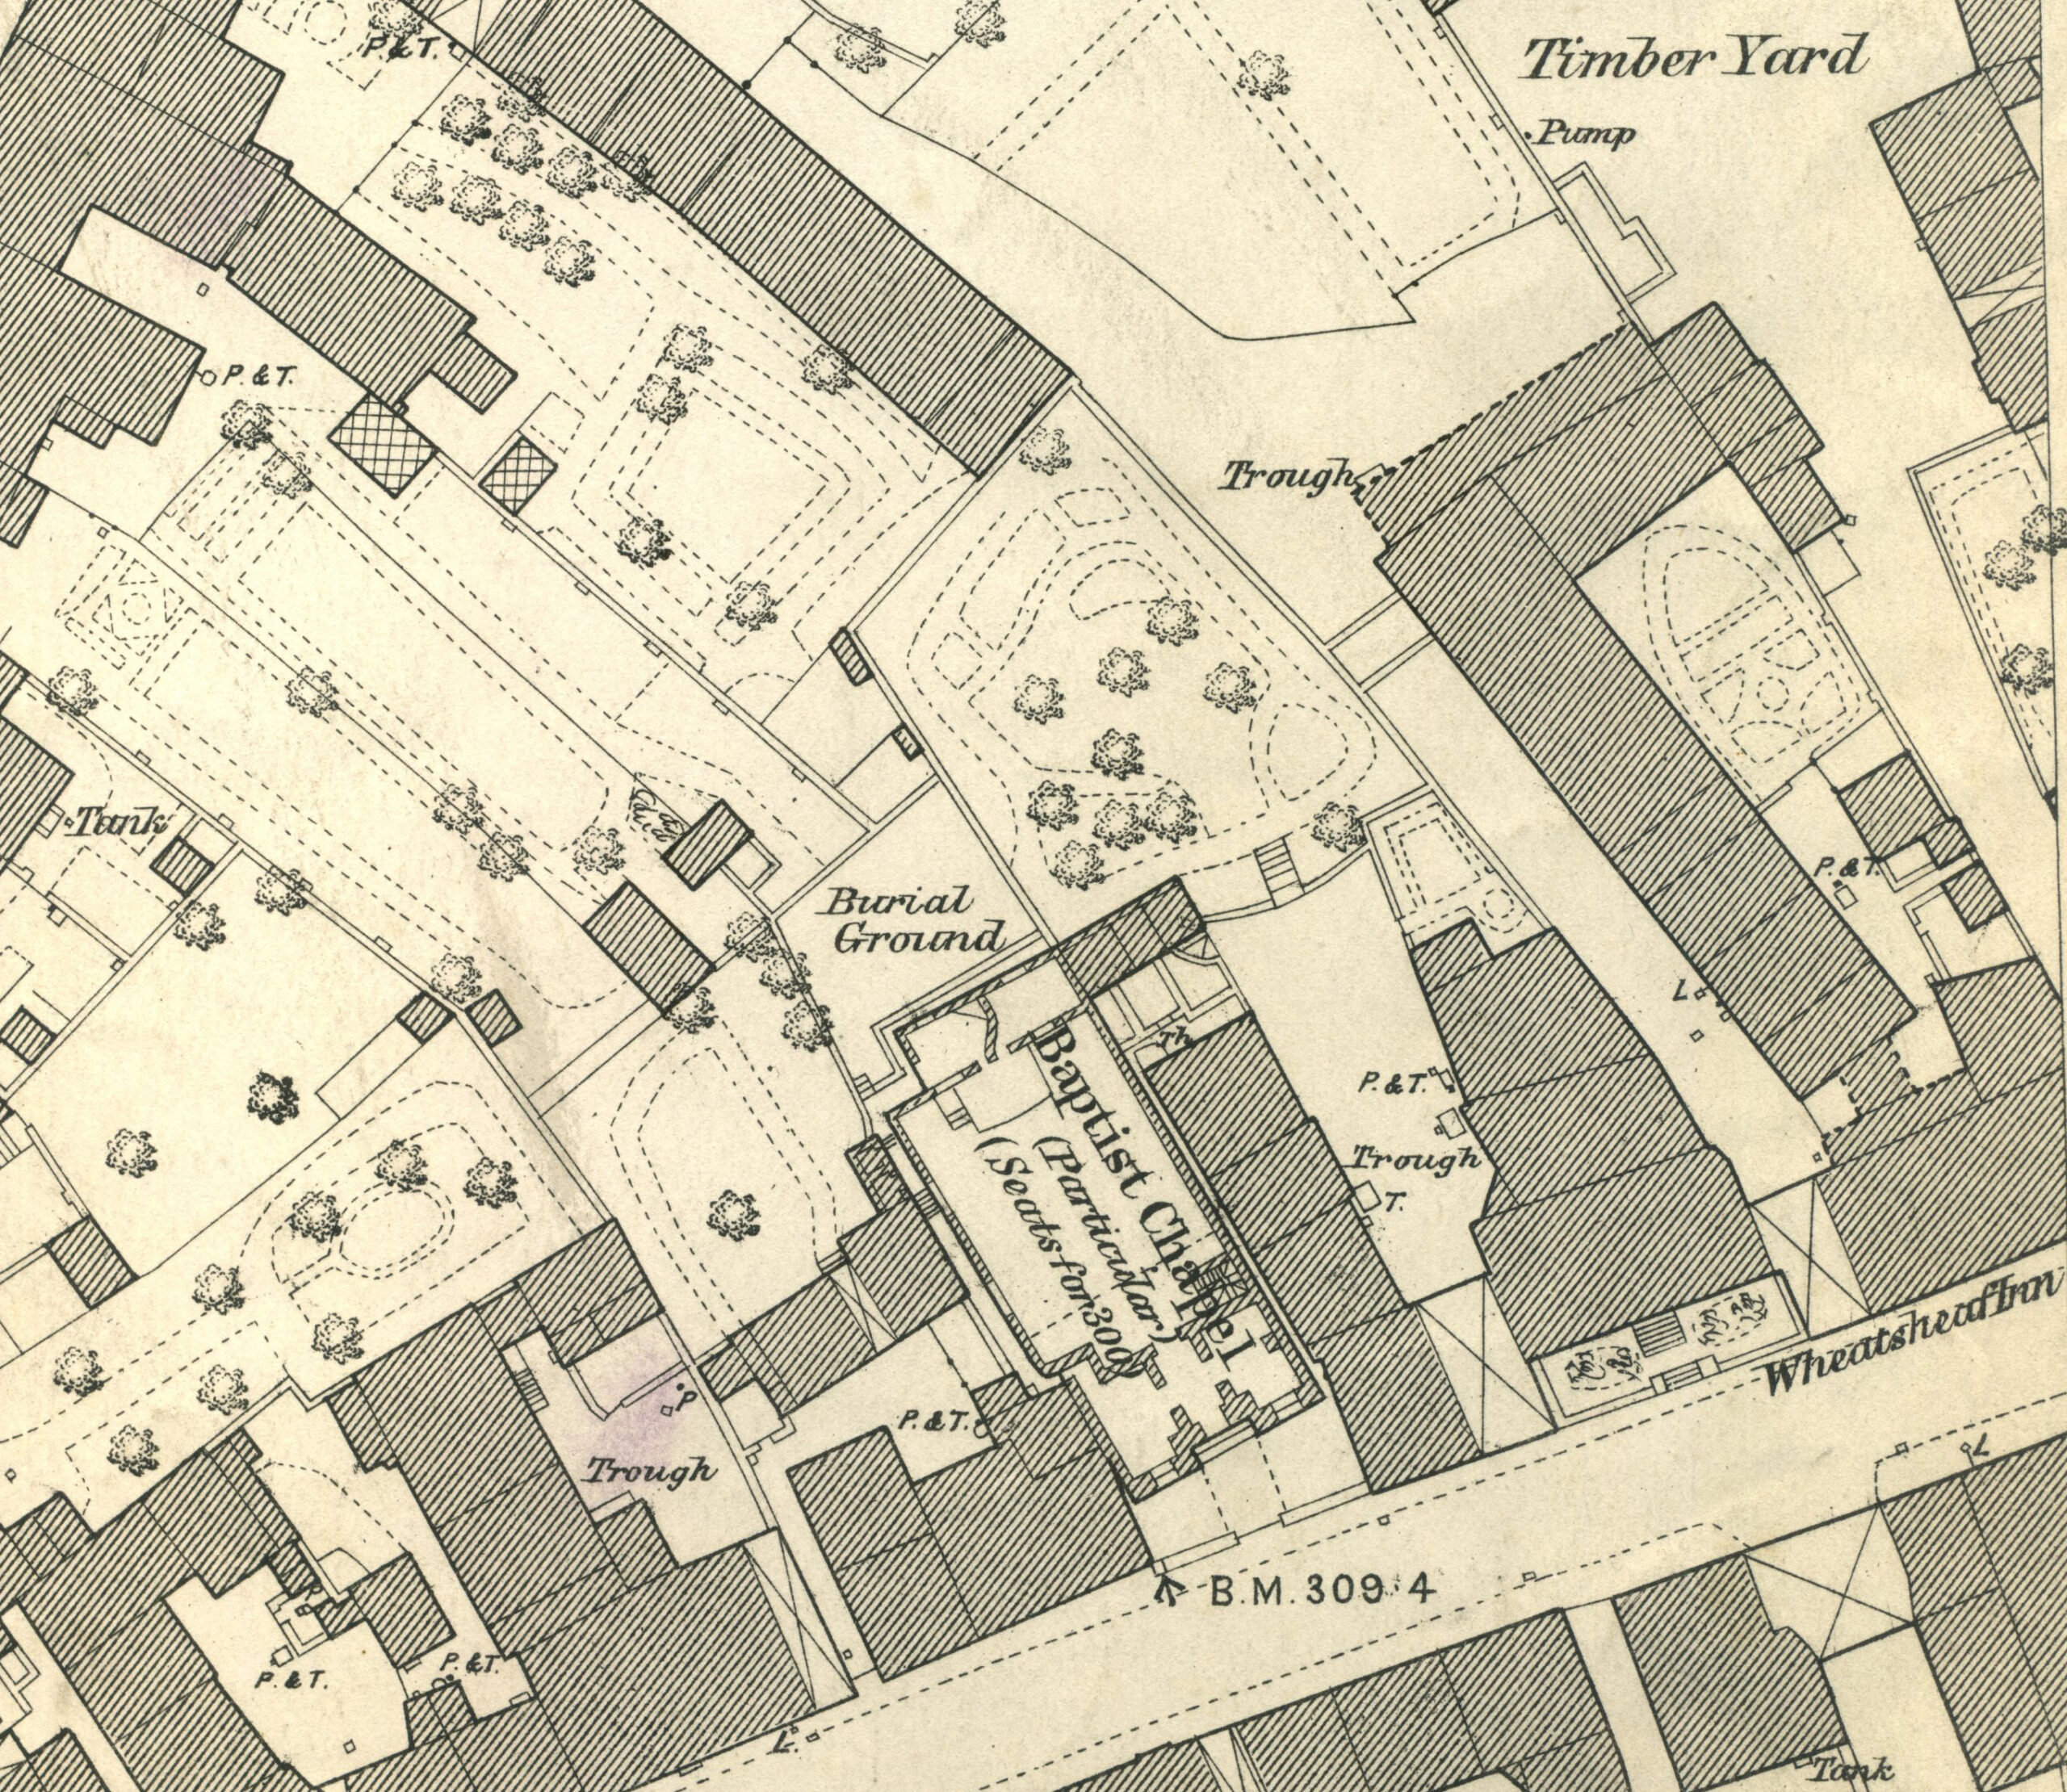
Figure 7. Detail from the 1:500 Ordnance Survey town map of Whitchurch, Shropshire, Sheet 7.4.4 (1880).
This is fig. 580 in Richard Oliver, “Ordnance Survey (Great Britain),” in Volume 5. Zincograph, 15 × 17 cm.
Courtesy of Richard Oliver.
Because the foundational triangulations of the national surveys had to be of high quality, they were also used to refine knowledge of the earth’s size and shape, assuming that the chains could be carried over long enough distances. The triangulations underpinning the surveys of the several German states were too small to have great significance in geodetic studies but, as Wolfgang Torge narrates in his Volume Five entry on “Geodetic Surveying in the German States,” increasing cooperation between their principal surveyors allowed the triangulations to be combined into larger networks. This history of cooperation allowed Johann Jacob Baeyer to successfully propose in 1861 that the Prussian government organize a collaborative effort to survey a large geodetic network across central Europe. Other states rapidly signed onto the mitteleuropäische Gradmessung (central European degree measurement), turning it first into the Europäische Gradmessung (European degree measurement) in 1867 and then into the Internationale Erdmessung or International Geodetic Association in 1886.
Apparent Achievement of System
In many territories, however, governments lacked the capacity to make systematic surveys in which detailed topographical and cadastral work was based on high-quality, error-minimizing triangulations. This was especially the case in regions lacking older detailed maps that might be used while everyone awaited the publication of new topographical maps. French citizens could still use the century-old Cassini maps while they waited for the new sheets of the carte de l’État-major, the English had access to the older large-scale county surveys while they awaited the Ordnance Survey’s new one-inch sheets. But what about in British India or in the western United States? In South Asia, British civil and military officials did adapt some existing Indian maps to their needs, but they generally made their own surveys of newly acquired territories as soon as they could, almost none based on the geodetic triangulation of the Great Trigonometrical Survey of India. From 1827 through 1906, first in London and after 1870 in Calcutta, the British compiled sheets for the Atlas of India at 1:253,440 from multiple sources, as they became available, eventually covering most of South Asia in a standardized look and with the appearance of order and system (fig. 8).
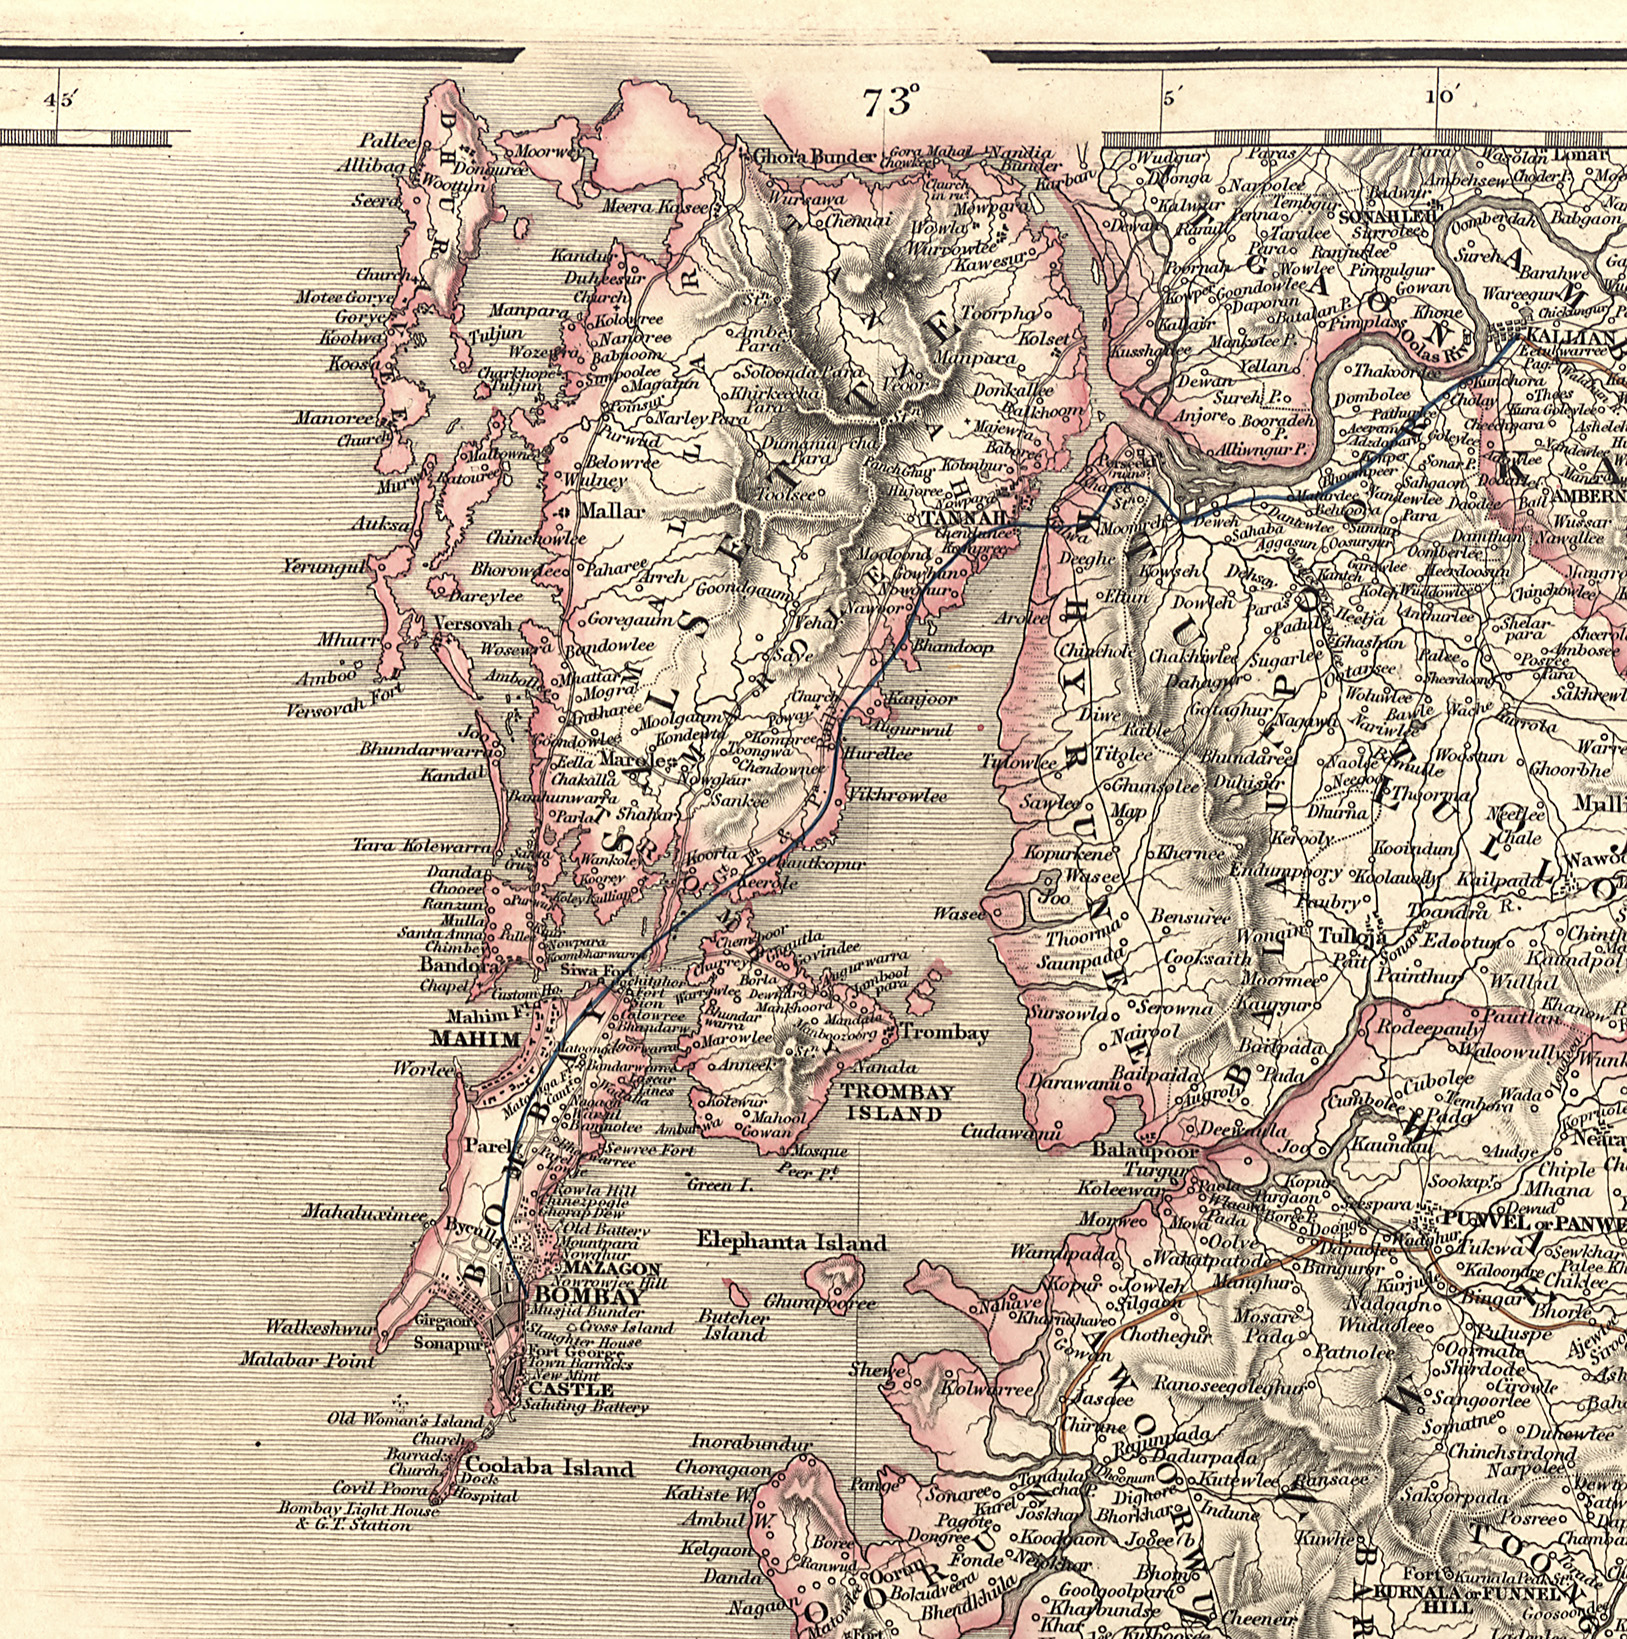
This is fig. 267 in Peter Collier, “East India Company (Great Britain),” in Volume 5.
Courtesy of the Geography and Map Division, Library of Congress, Washington, D.C. (G2280 .G7 1862); online at https://www.loc.gov/resource/g7650m.gct00196/?sp=4.
Similar problems plagued some of the supposedly systematic mapping in the United States. The high demand after 1825 for detailed and correct charts of the Great Lakes—as Americans settled their southern shores and used the lakes to ship out grain, meat, and ores and to ship in manufactured goods and foodstuffs—led Congress to authorize the U.S. Lake Survey, undertaken by the Corps of [Topographical] Engineers in 1841–82 (fig. 9). As I discuss in my entry on “Marine Mapping in the United States,” the Lake Survey undertook a careful, geodetic-quality triangulation, ostensibly to serve as the basis for its hydrographic work: however, the end of the survey came with the completion of the triangulation, which had not served as the foundation of any of the Lake Survey’s seventy-six published charts! In the 1870s, the federal government dispatched four expeditions to survey the lands, peoples, and resources of the territory that had been opened up by the completion of the Union Pacific Railroad in 1869, all of which were too rapid to have been based on comprehensive triangulations. That did not stop George M. Wheeler, the engineer in charge of the U.S. Geographical Survey West of the 100th Meridian, from issuing a sheet explaining some of the signs used for his topographical maps, a sheet which seemed to proclaim (incorrectly) that Wheeler’s survey had featured a foundation of triangulation (fig. 10).
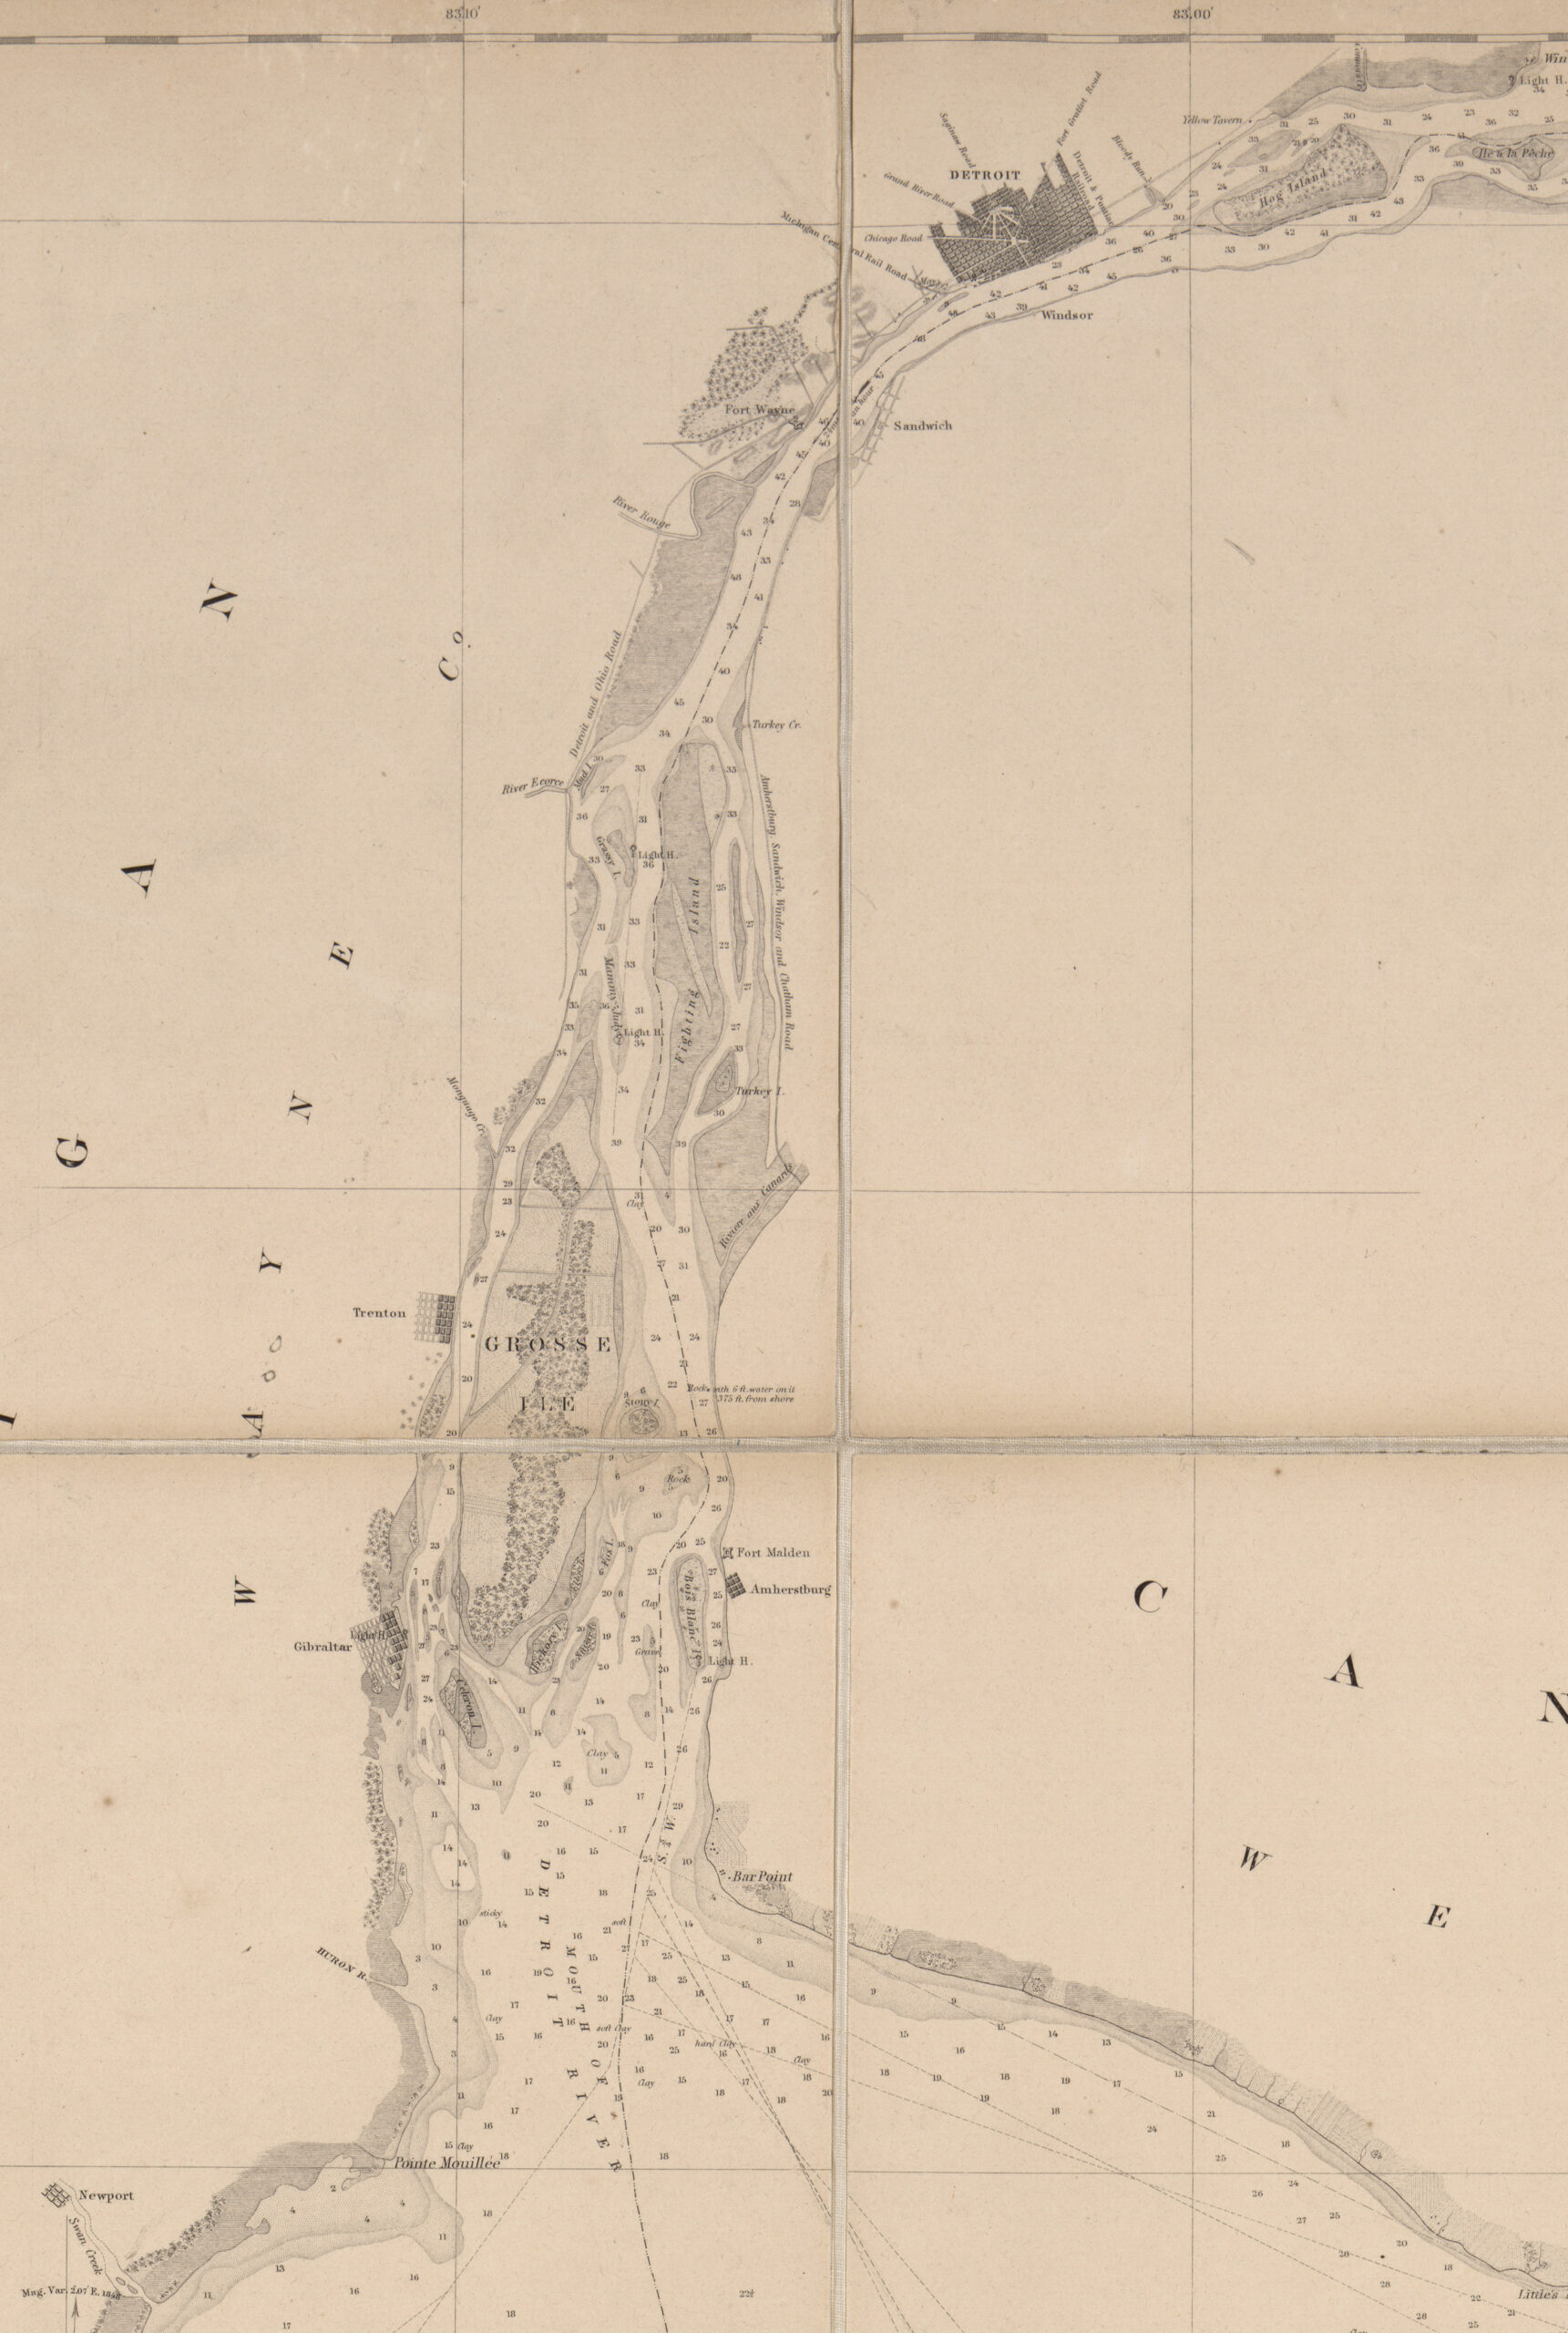
Figure 9. Detail of the Detroit River from West End of Lake Erie and Detroit River (Washington, D.C., 1849, updated to 1852), based on a local triangulation of the Detroit River by Lieutenant J. N. Macomb, topography by Macomb and other topographical engineers conducting the U.S. Lake Survey.
Lithograph, 91 × 72 cm, folded to 24 × 15 cm.
Courtesy of the Geography and Map Division, Library of Congress, Washington, D.C. (G3312.E7 1849 .U51); online at https://www.loc.gov/item/2017588900/.
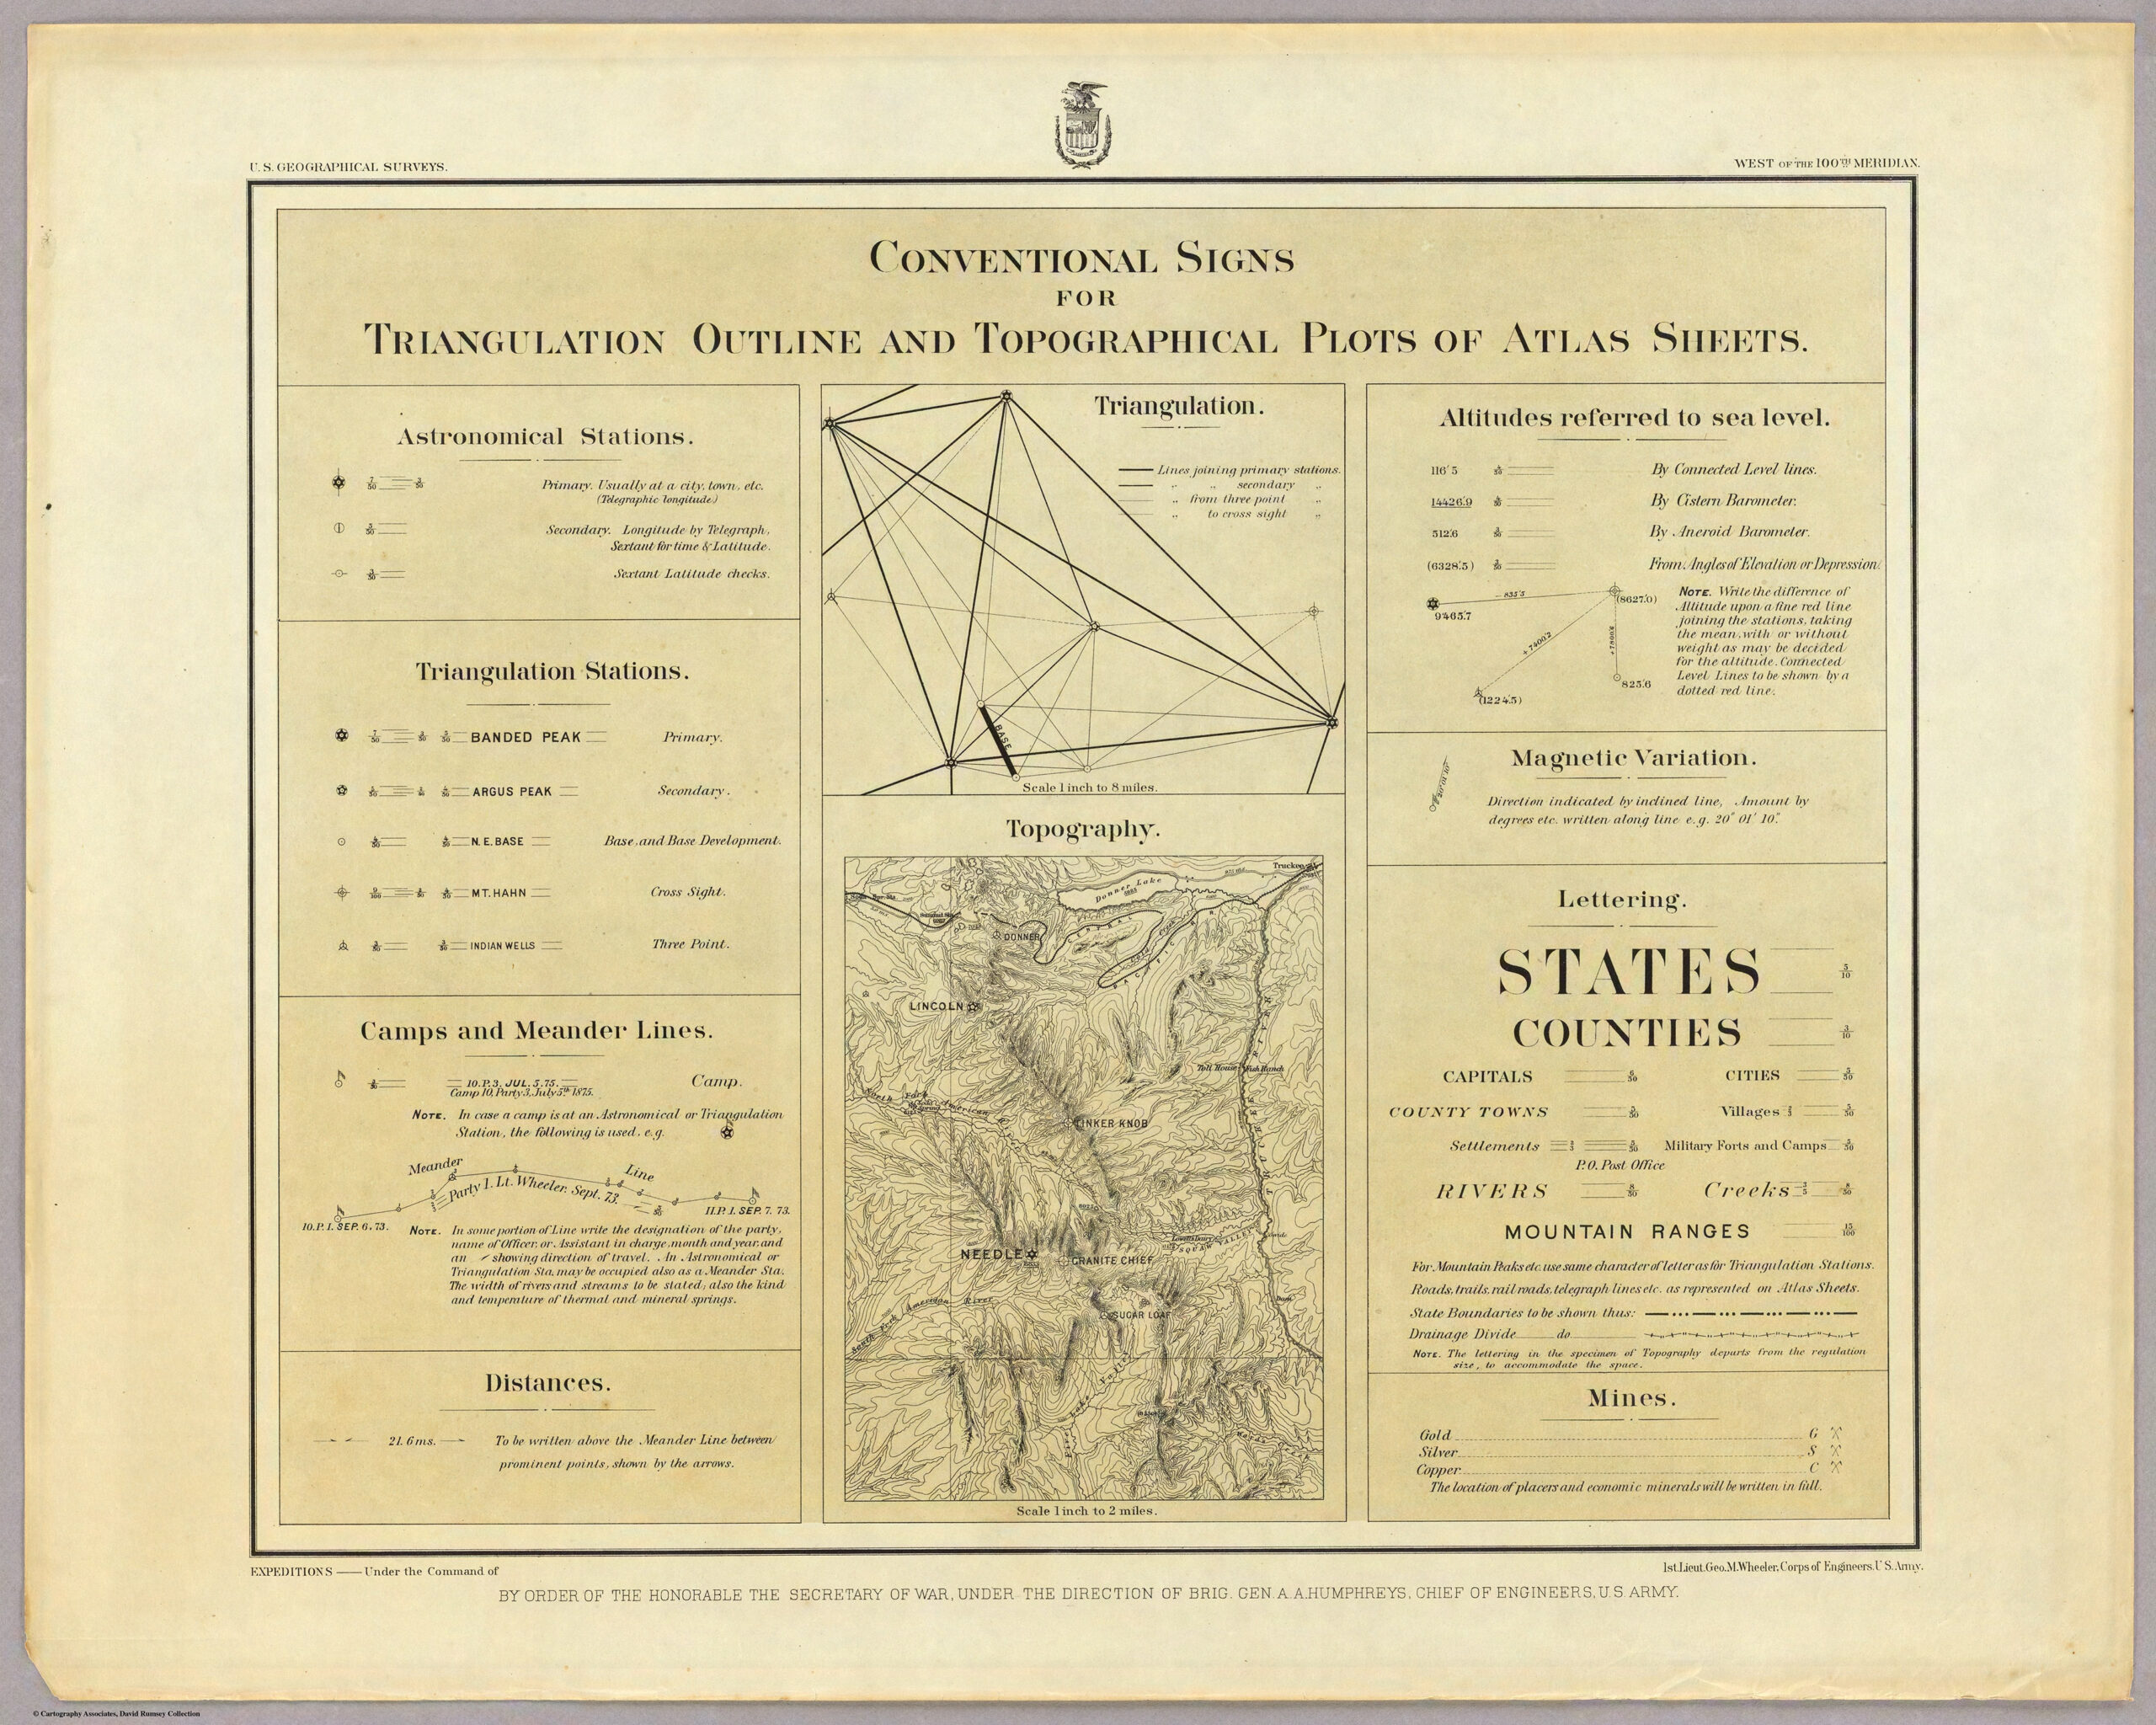
Lithograph, 49 × 61 cm.
Courtesy of Cartography Associates (P1281-16); online at davidrumsey.com.
After 1900, European and North American national mapping agencies reorganized themselves into a state of permanent revision rather than of conducting surveys de novo, as discussed in Volume Six of The History of Cartography. Yet much territorial work continued with only the appearance of system. In particular, the huge project of the International Map of the World, at 1:1,000,000, was carried on by multiple mapping agencies to a (mostly) consistent design (fig. 11). For the most part, however, its sheets were compiled from multiple geographical sources, as revealed by their reliability diagrams; that on the sheet La Paz (1922) distinguished between areas of local triangulations and “reliable” itinerary traverses, on the one hand, and, on the other, more “approximate” traverses and infilling from other maps (fig. 12).
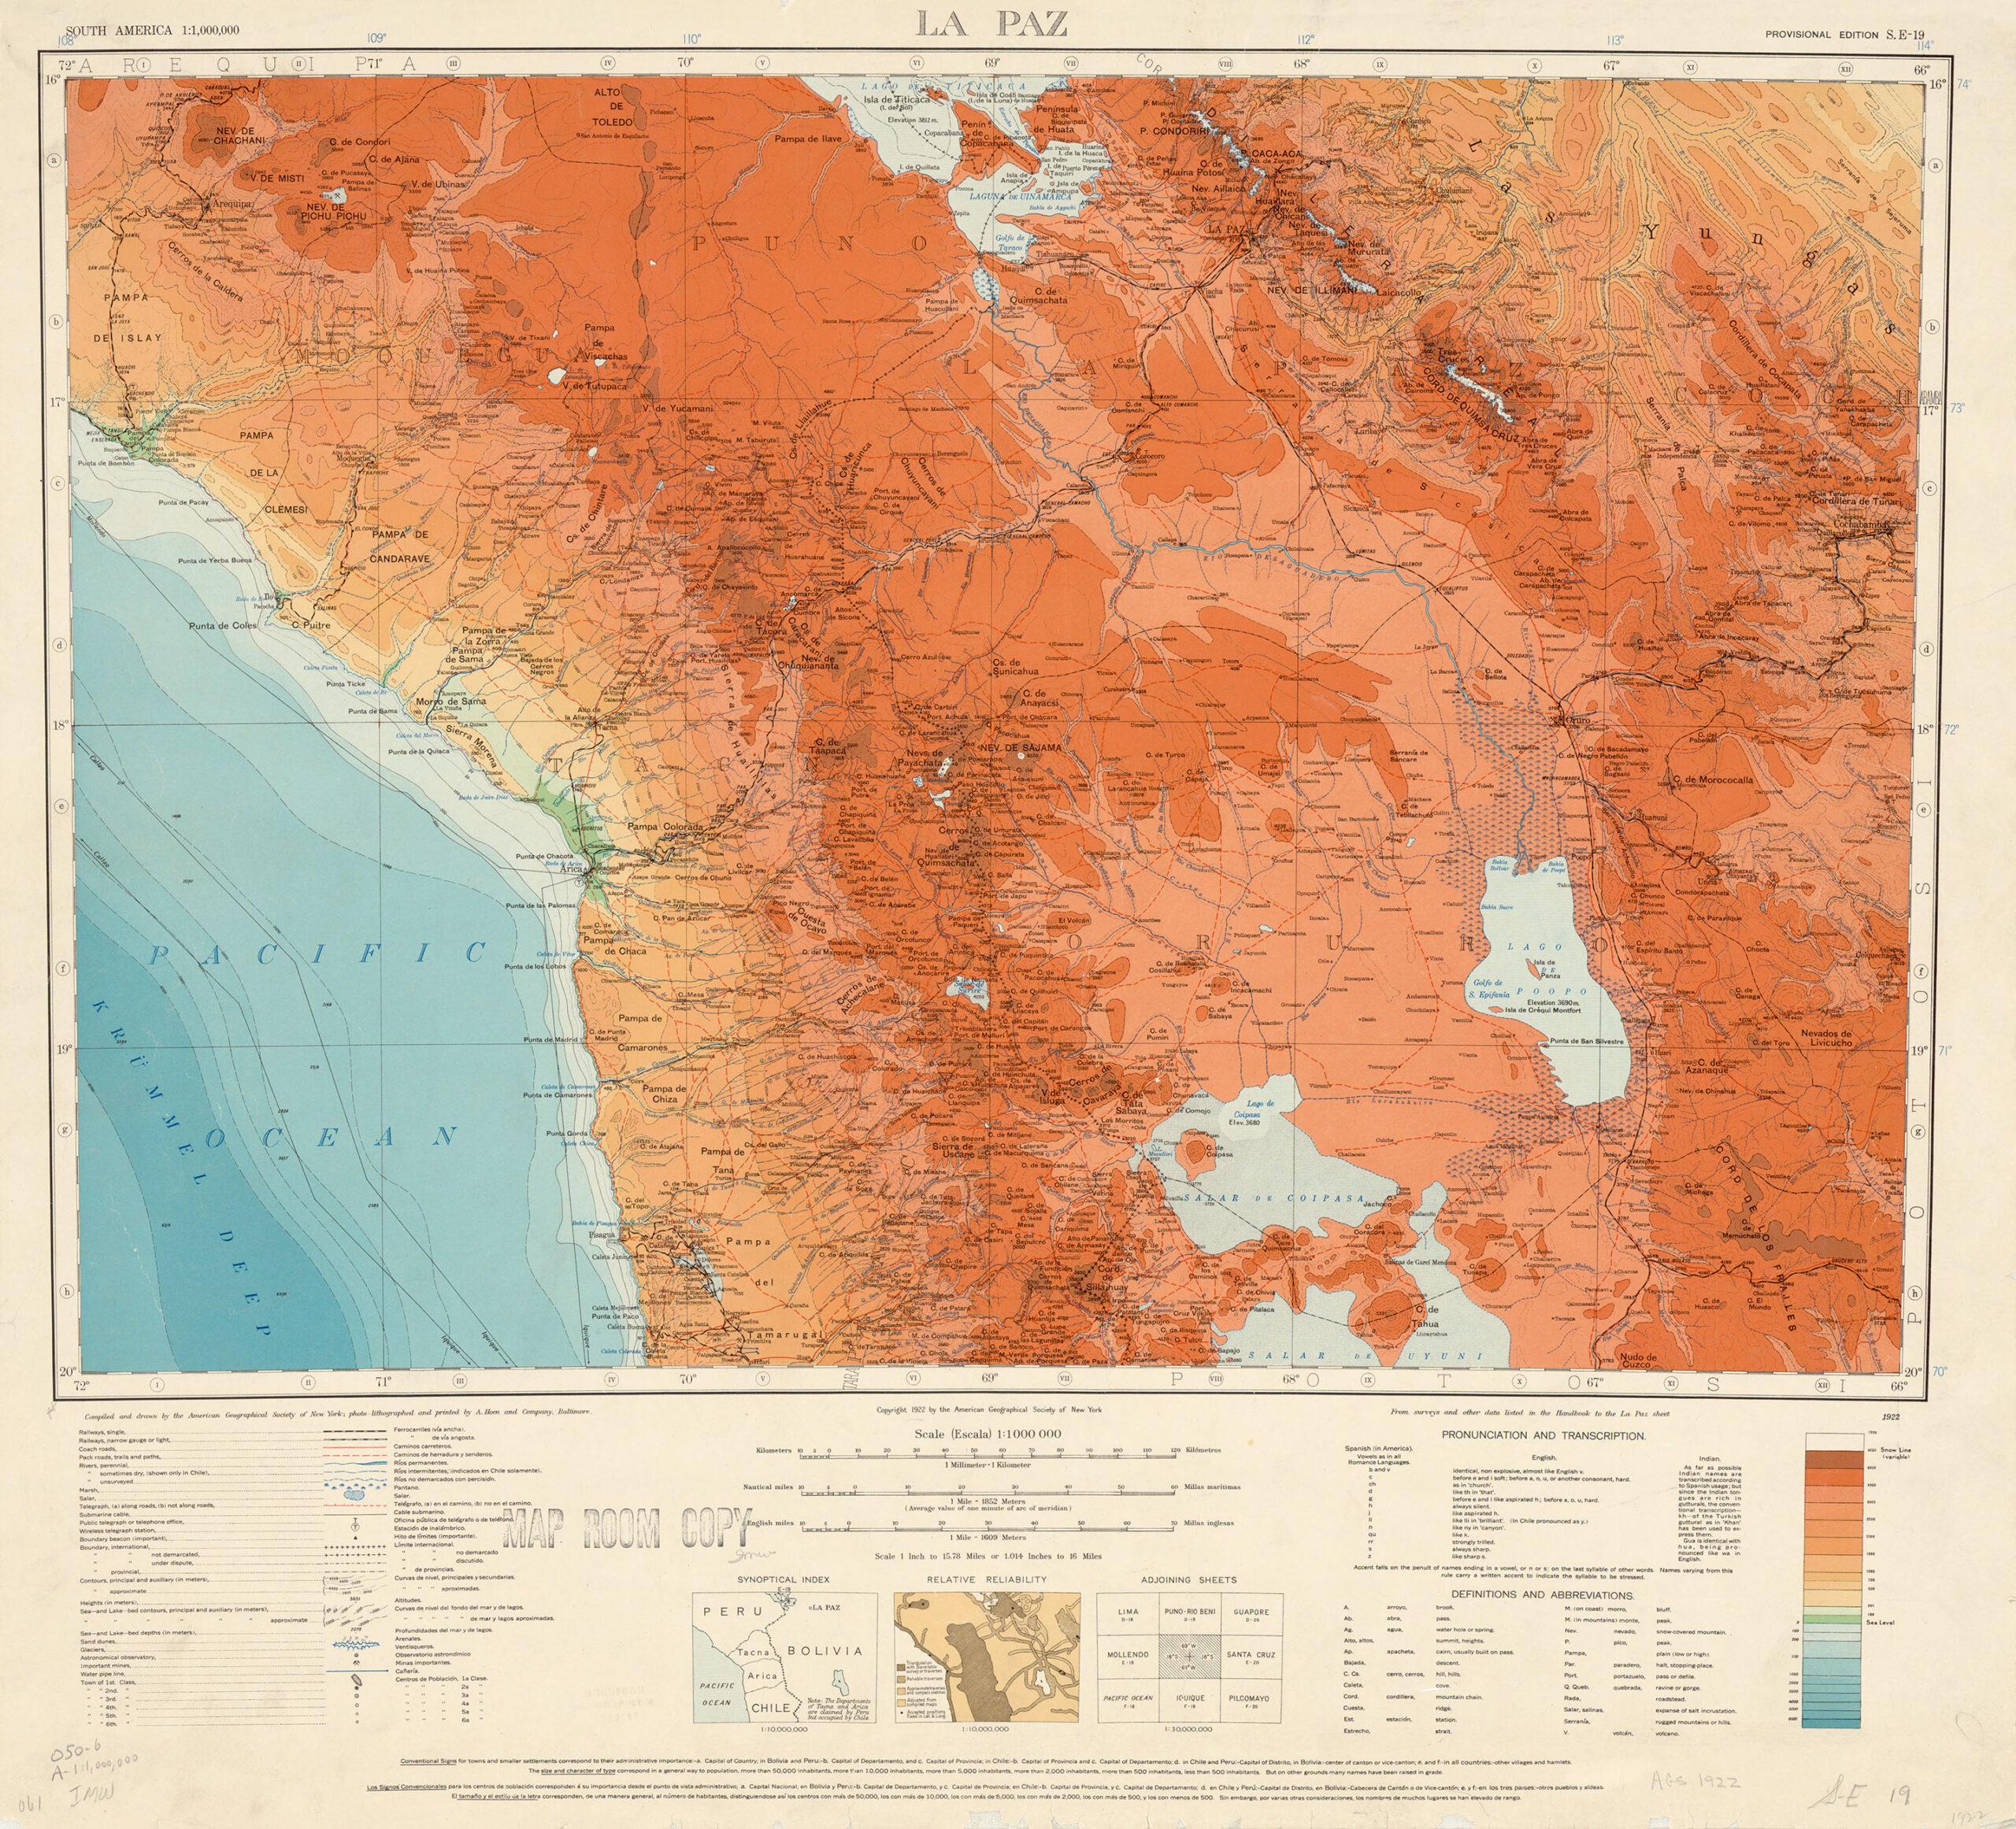
Figure 11. La Paz (Provisional Edition, S. E-19), 1:1,000,000 (New York, 1922), prepared and published by the American Geographical Society for its “Map of Hispanic America,” as a component of the International Map of the World.
This is fig. 411 in Alistair Pearson, “International Map of the World,” in Volume 6.
Color lithograph, 61.5 × 66.2 cm.
Courtesy of the American Geographical Society Library, University of Wisconsin–Milwaukee Libraries.
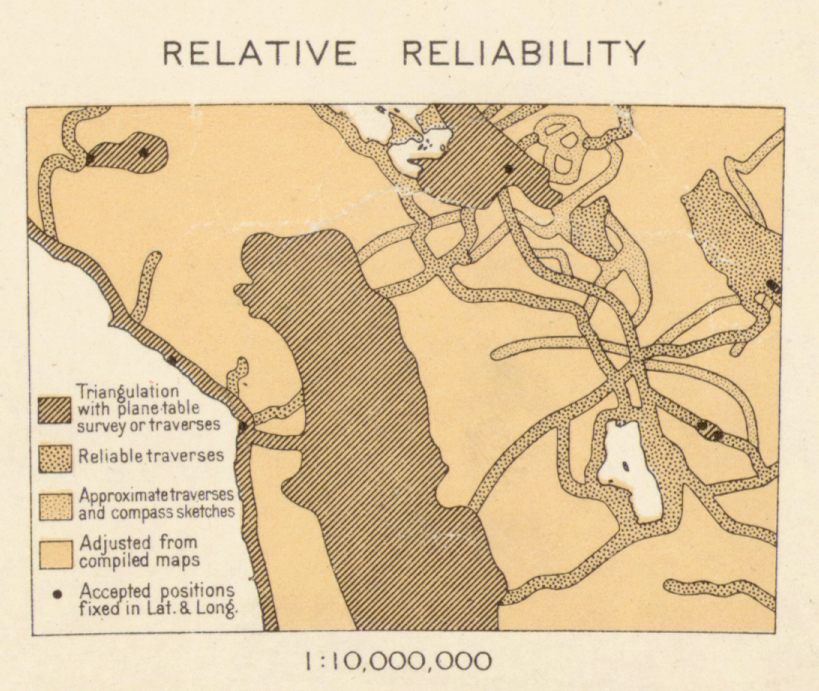
Figure 12. “Relative Reliability” diagram from La Paz (fig. 11, above).
“Cartography”
As the ambitious plans of the French, Bavarians, and British suggest, the idea of systematic, national surveys had great intellectual appeal. So much so, in fact, that they underpinned the truly new endeavor of “cartography.” Conrad Malte-Brun, in Paris in 1808, offered the neologism of “chartographie” for the compilation of existing surveys into a coherent, detailed, multisheet map of a country, controlled by astronomical observations. The new word did not then catch on, but it would when Malte-Brun started to use it again in the later 1820s in the context of triangulation-based, systematic surveys. Now “cartography” was used to embrace all the mapping of the earth, from detailed surveying of properties and landscapes to hydrographic charting to regional mapping. All “cartography” was founded on the new technology of systematic surveys, including regional maps created by simplifying and generalizing large-scale topographical map series (fig. 13). Eventually, by the end of the nineteenth century, as I detail in my entry in Volume Five on “Cartography,” geographers were adding numerical ratios of map scale even to world maps, pointing to their proper foundation in detailed national surveys.
Colored lithograph, detail 33 × 37 cm.
Courtesy of ETH-Bibliothek, Zürich (Rar Ka 99); online at www.e-rara.ch/doi/10.3931/e-rara-71709.
This new idea—of a unified, singular endeavor of cartography—clearly faced significant practical hurdles. The mapping of British India, the American West, and the International Map of the World indicates some of the difficulties encountered when money, personnel, and above all time were in short supply. In this respect, cartography has always had an aspirational quality, holding out the future perfection of the map of the world. This idealism was plainly expressed in 1852 by J. R. Jackson, a retired army staff officer. Writing a section on “Chartography” in an advanced textbook on geography, Jackson held out the prospect that systematic surveys would displace more irregular regional mapping even as modern civilization displaced older forms of life.
Thus, the interior of South America, though, to the eye, well filled in upon the map, offers but a distant approximation to truth; and when, in after years, the axe shall have cleared the secular forests of that portion of the New World, and the vast regions that extend from the Andes to the Atlantic, shall be covered with the abundant harvests and the habitations of a dense population, the maps of the country then constructed will, upon a comparison with those now existing, show our descendants how wide of the truth were our maps in the position of many places, and how totally different the true course of its rivers from what we now figure them with such show of accuracy.… The greater part of Europe alone and of the United States may be said to be correctly mapped from trigonometrical surveys. Indeed, if nothing were set down on the maps of other parts of the earth but what has been really determined in a satisfactory manner, the maps of them would present, for the most part, so much blank paper.
(Manual of Geographical Science, Mathematical, Physical, Historical, and Descriptive)
Eventually, though, all that blank paper must succumb to all the effort being paid to “the exact representation of the earth’s surface, and the correct setting down of man’s various habitations,” as Jackson wrote further.
When map historians, such as Lloyd Brown, began in the mid-twentieth century to study the history of the national surveys, they were strongly motivated by the sense of their imminent perfection. The prospect of the rapid completion of the world’s great geodetic surveys (needed to help determine the earth’s gravitational field, knowledge that was key for accurate flight of intercontinental ballistic missiles) and of extensive campaigns of aerial photography for landscape mapping held out the prospect of the completion of the world map.
That same idealism led Brian Harley and David Woodward to formulate The History of Cartography as a comprehensive map of the intellectual territory of the history of cartography. Undertaking the series has come with its fair share of pragmatic problems, but the end is close. We are in the process of preparing Volume Five for publication, carefully reviewing the work of the University of Chicago Press to ensure that the published work will indeed be a readable, accurate, and comprehensive account. Please help us across the finish line by offering your monetary support by clicking on the “Make a Gift” button at the top right of this page. Thank you!
Matthew H. Edney