Education Design Challenge
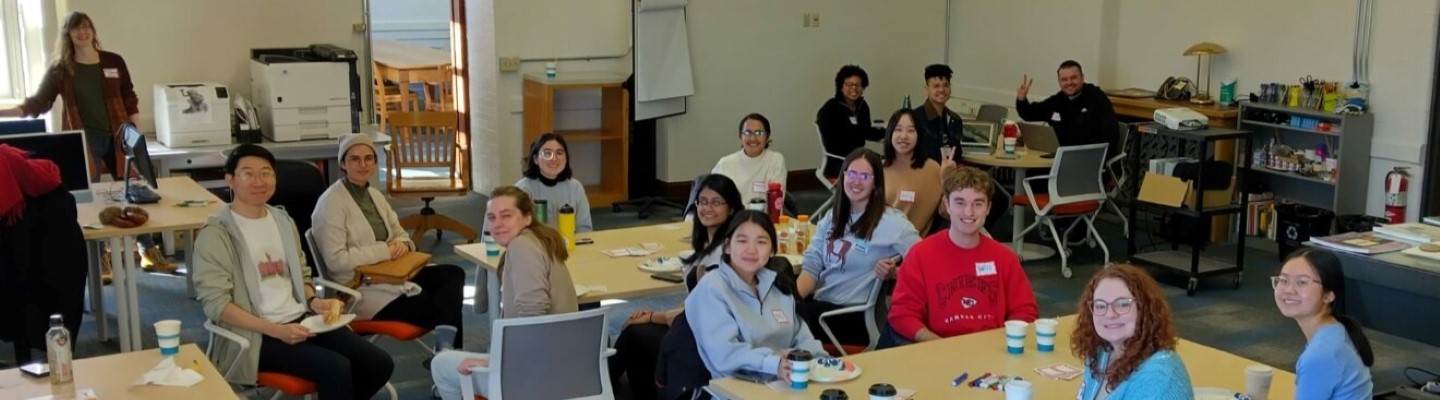
The Cart Lab Design Challenge is an annual event organized by the UW–Madison Cartography Lab and the Department of Geography. The Design Challenge is a one-day mapping workshop that challenges students (cartographers and geographers) to create a map or a series of maps during an eight-hour stretch. Teams of students work with community partners, topic experts, and data experts on real-world issues. In the past, our students have mapped the hazardous waste trade in North America, temporal fossil data to better understand past climates, community resources provided by a local community center making an argument for a new facility, and recidivism in our community.
Check out each Design Challenge below, including maps, awards, and blog posts.
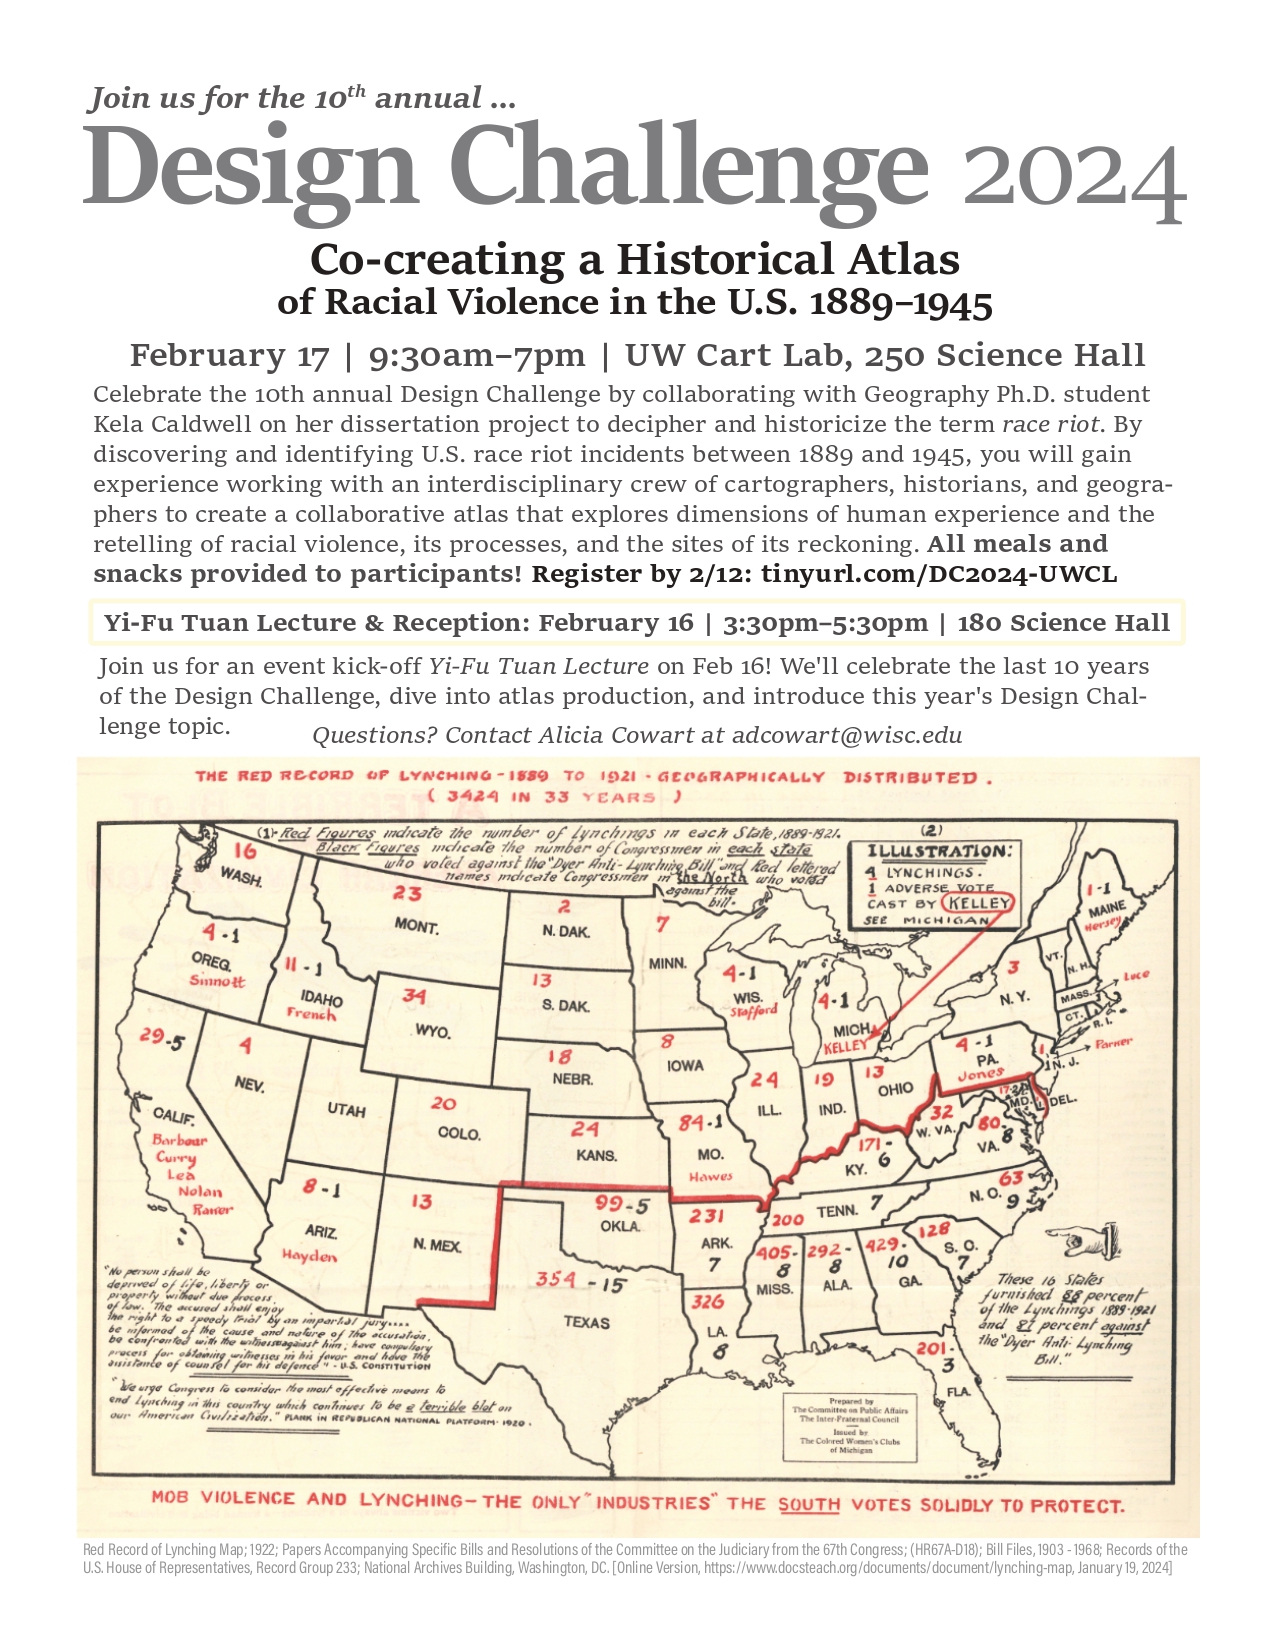
Celebrate the 10th annual Design Challenge by collaborating with Geography Ph.D. student Kela Caldwell on her dissertation project to decipher and historicize the term race riot. By discovering and identifying U.S. race riot incidents between 1889 and 1945, you will gain experience working with an interdisciplinary crew of cartographers, historians, and geographers to create a collaborative atlas that explores dimensions of human experience and the retelling of racial violence, its processes, and the sites of its reckoning.
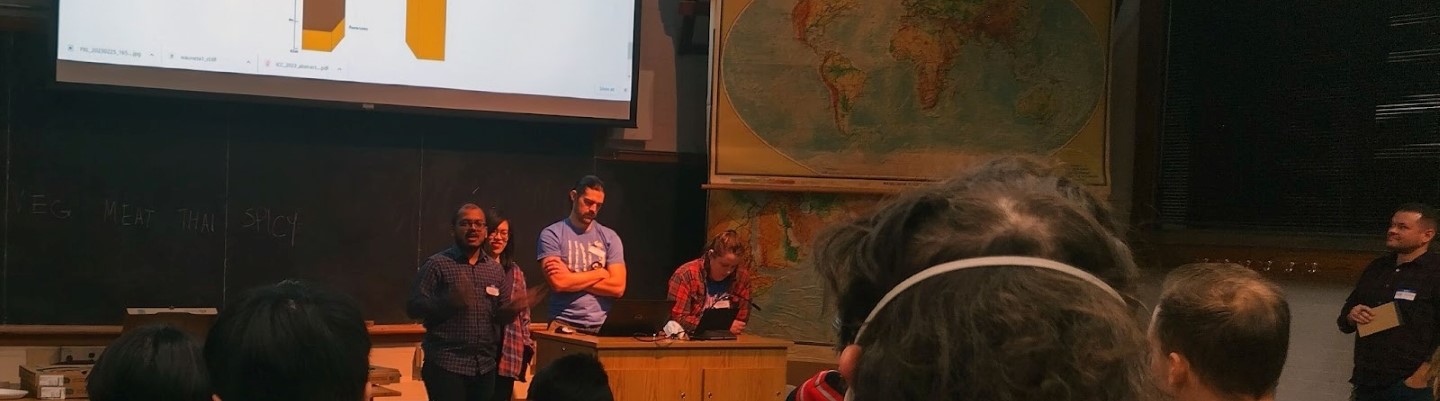
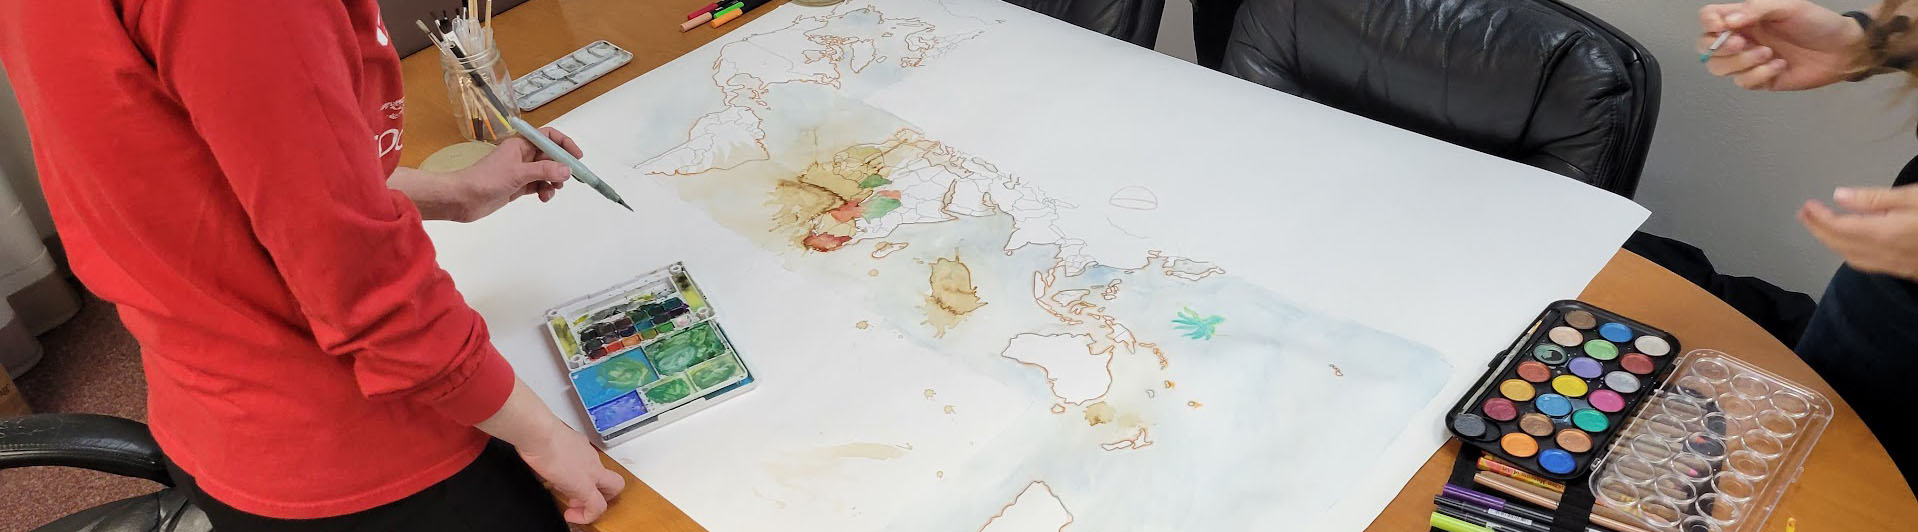
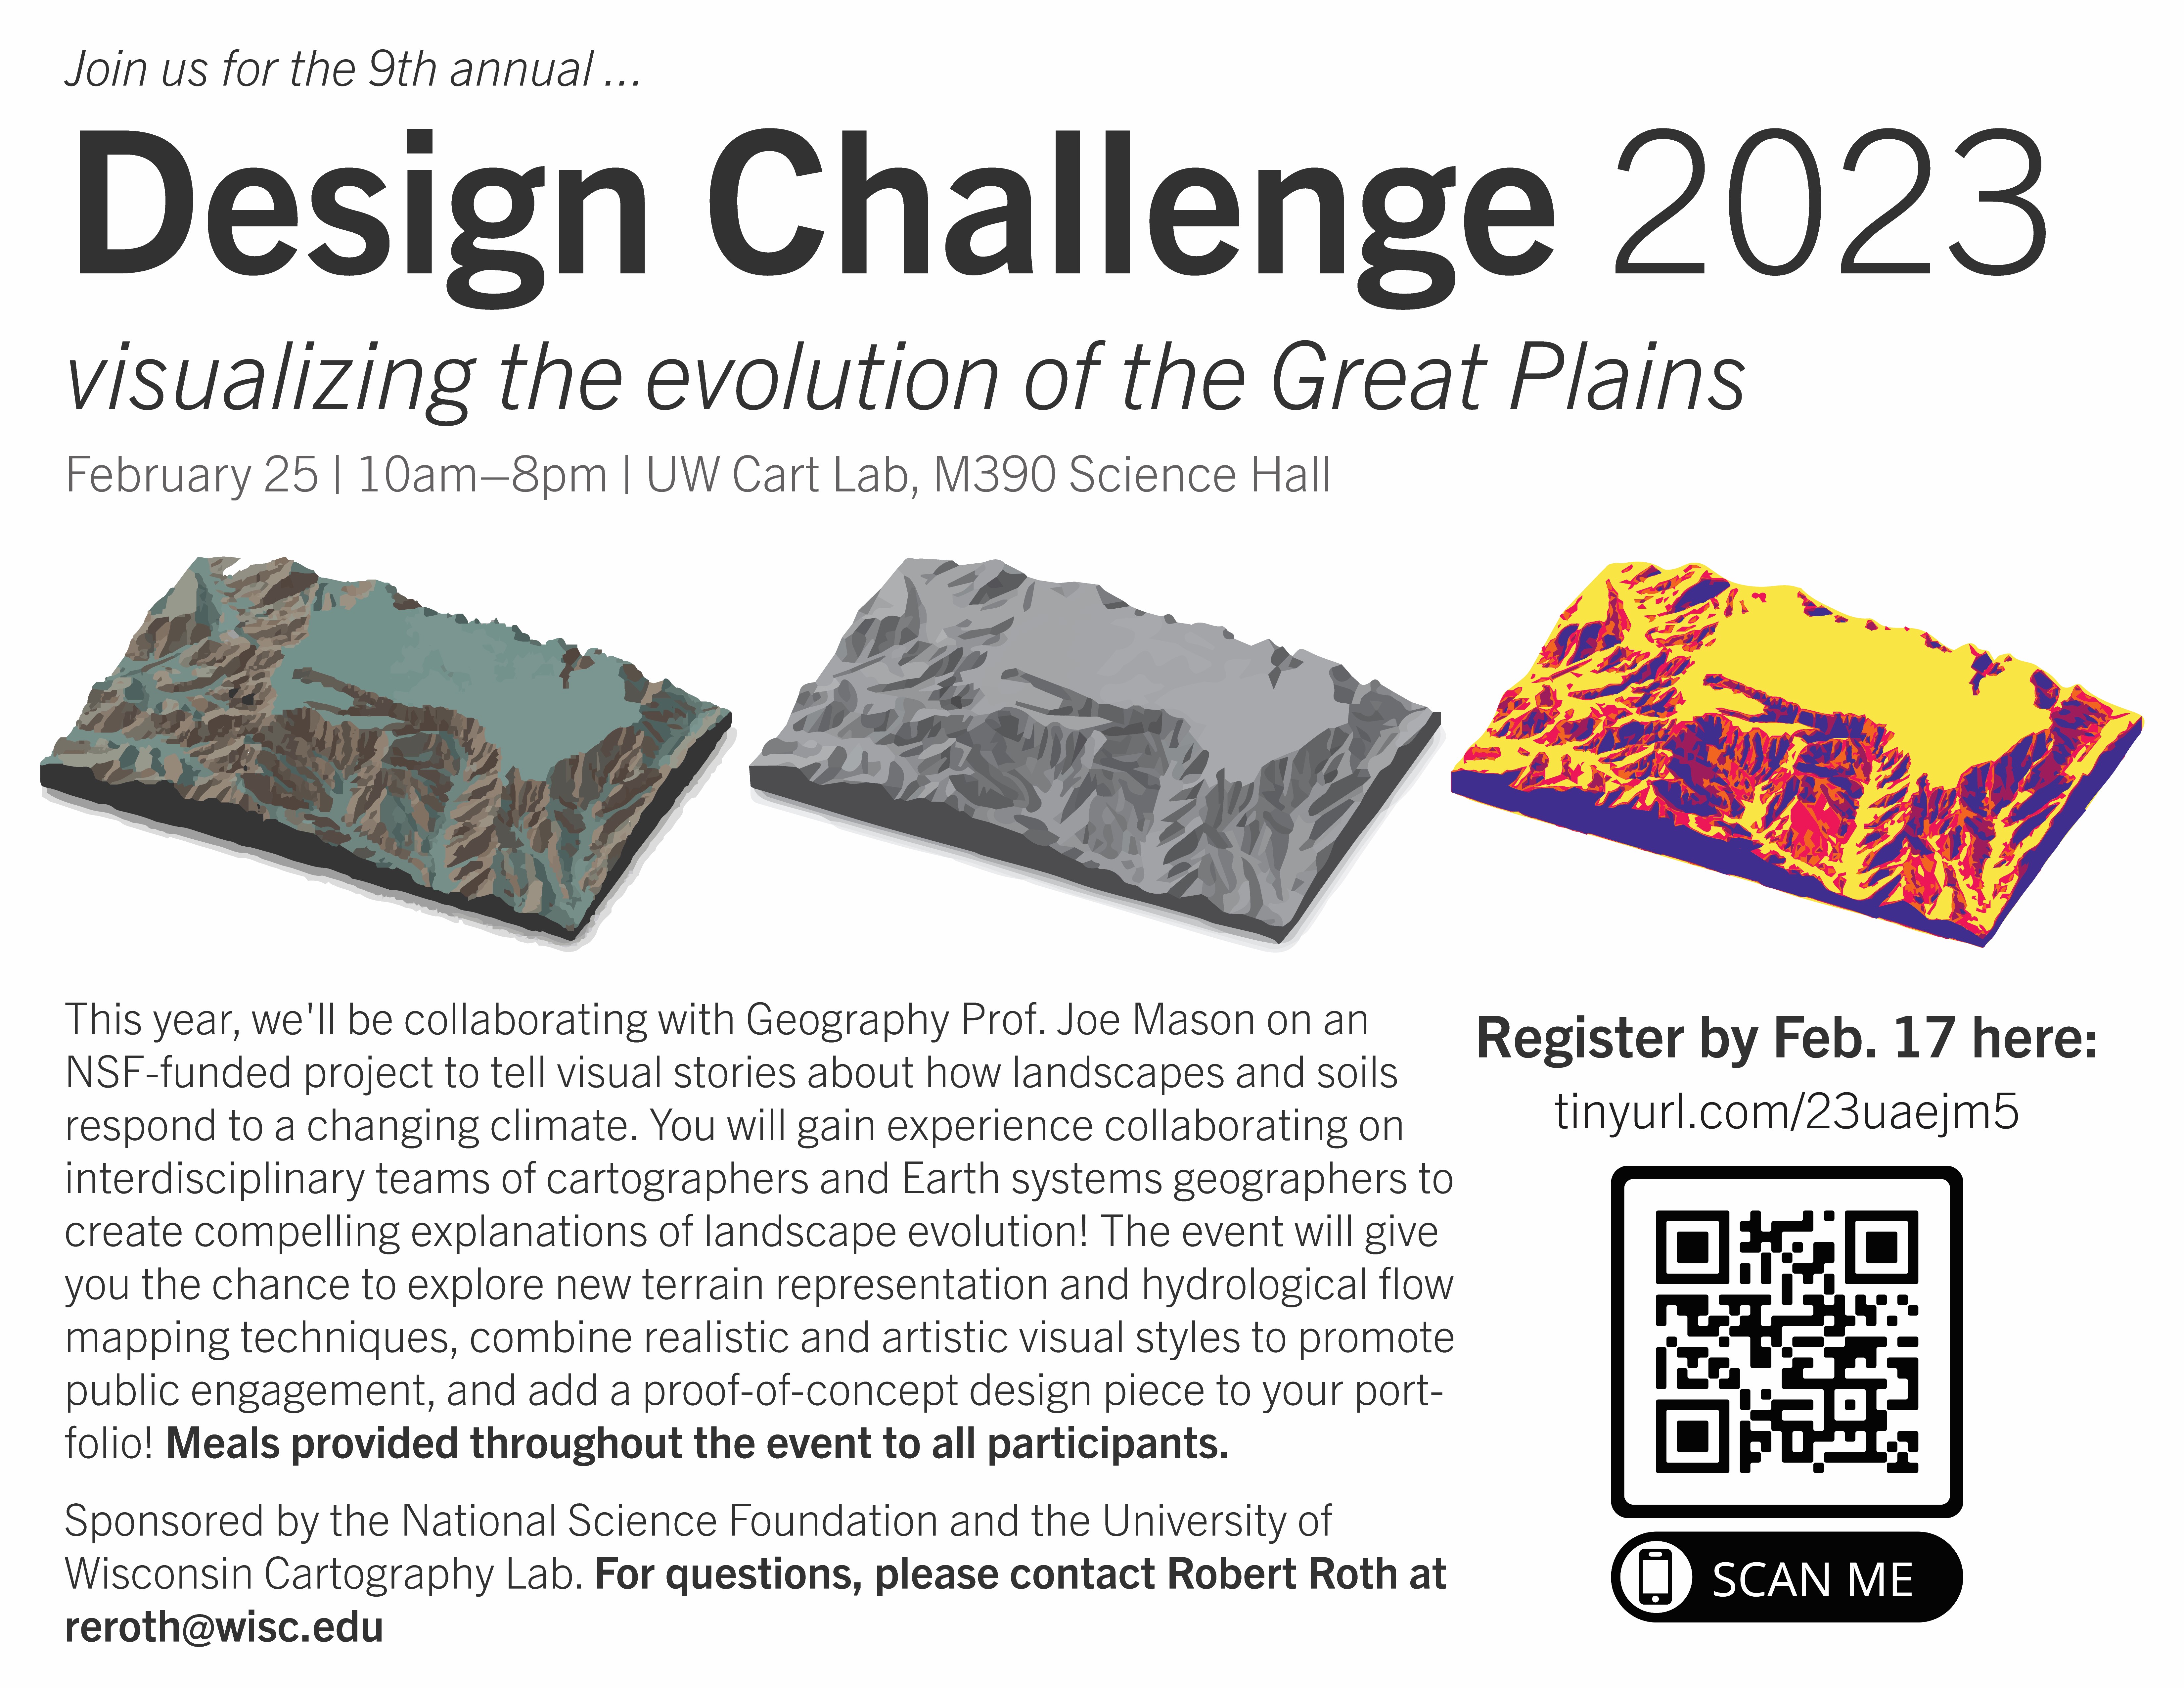
This year, we collaborated with Geography Prof. Joe Mason on an NSF-funded project to tell visual stories about how landscapes and soils in the central Great Plains respond to a changing climate. The Design Challenge focused specifically on loess tablelands, where productive agricultural land and carbon-rich surface and buried soils border abruptly on steep, rapidly eroding slopes. The NSF grant funded research on how erosion of these tablelands varied through past climates and how it will respond to a future climate with both more frequent drought and more frequent extreme precipitation events. Local residents in the study area are interested in the results, but more effective visual stories are clearly needed to communicate project findings to a broad audience. The proposal that the NSF funded specifically included a Cart Lab Design Challenge with that goal.
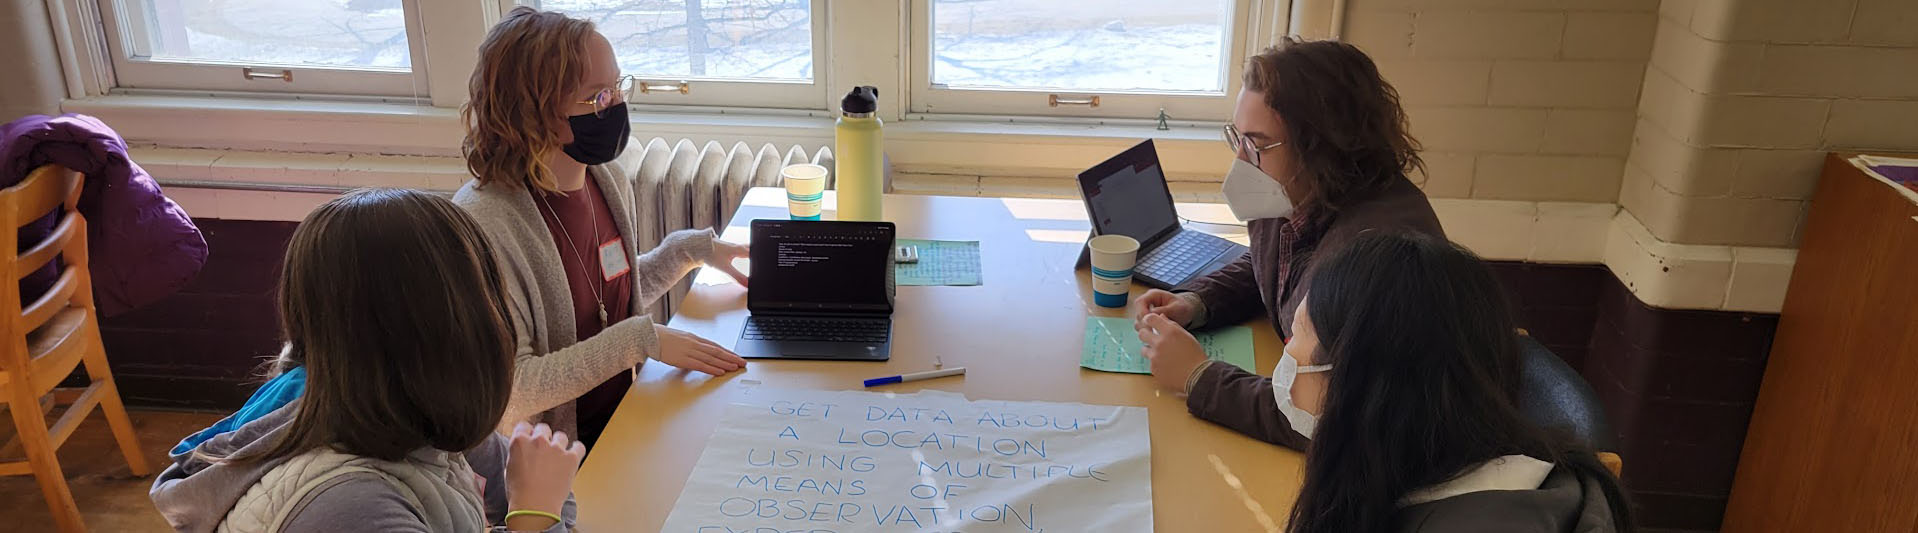
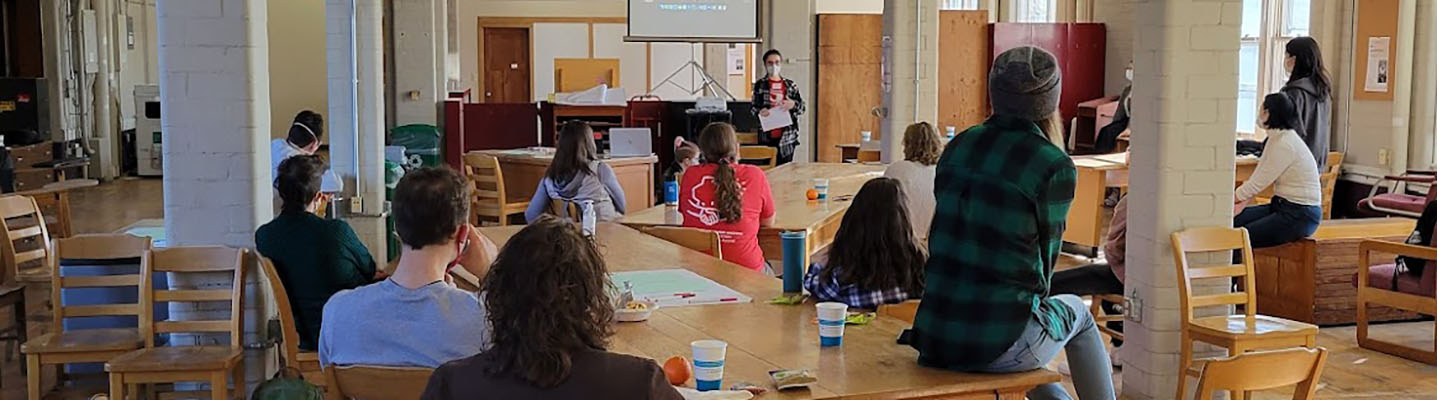
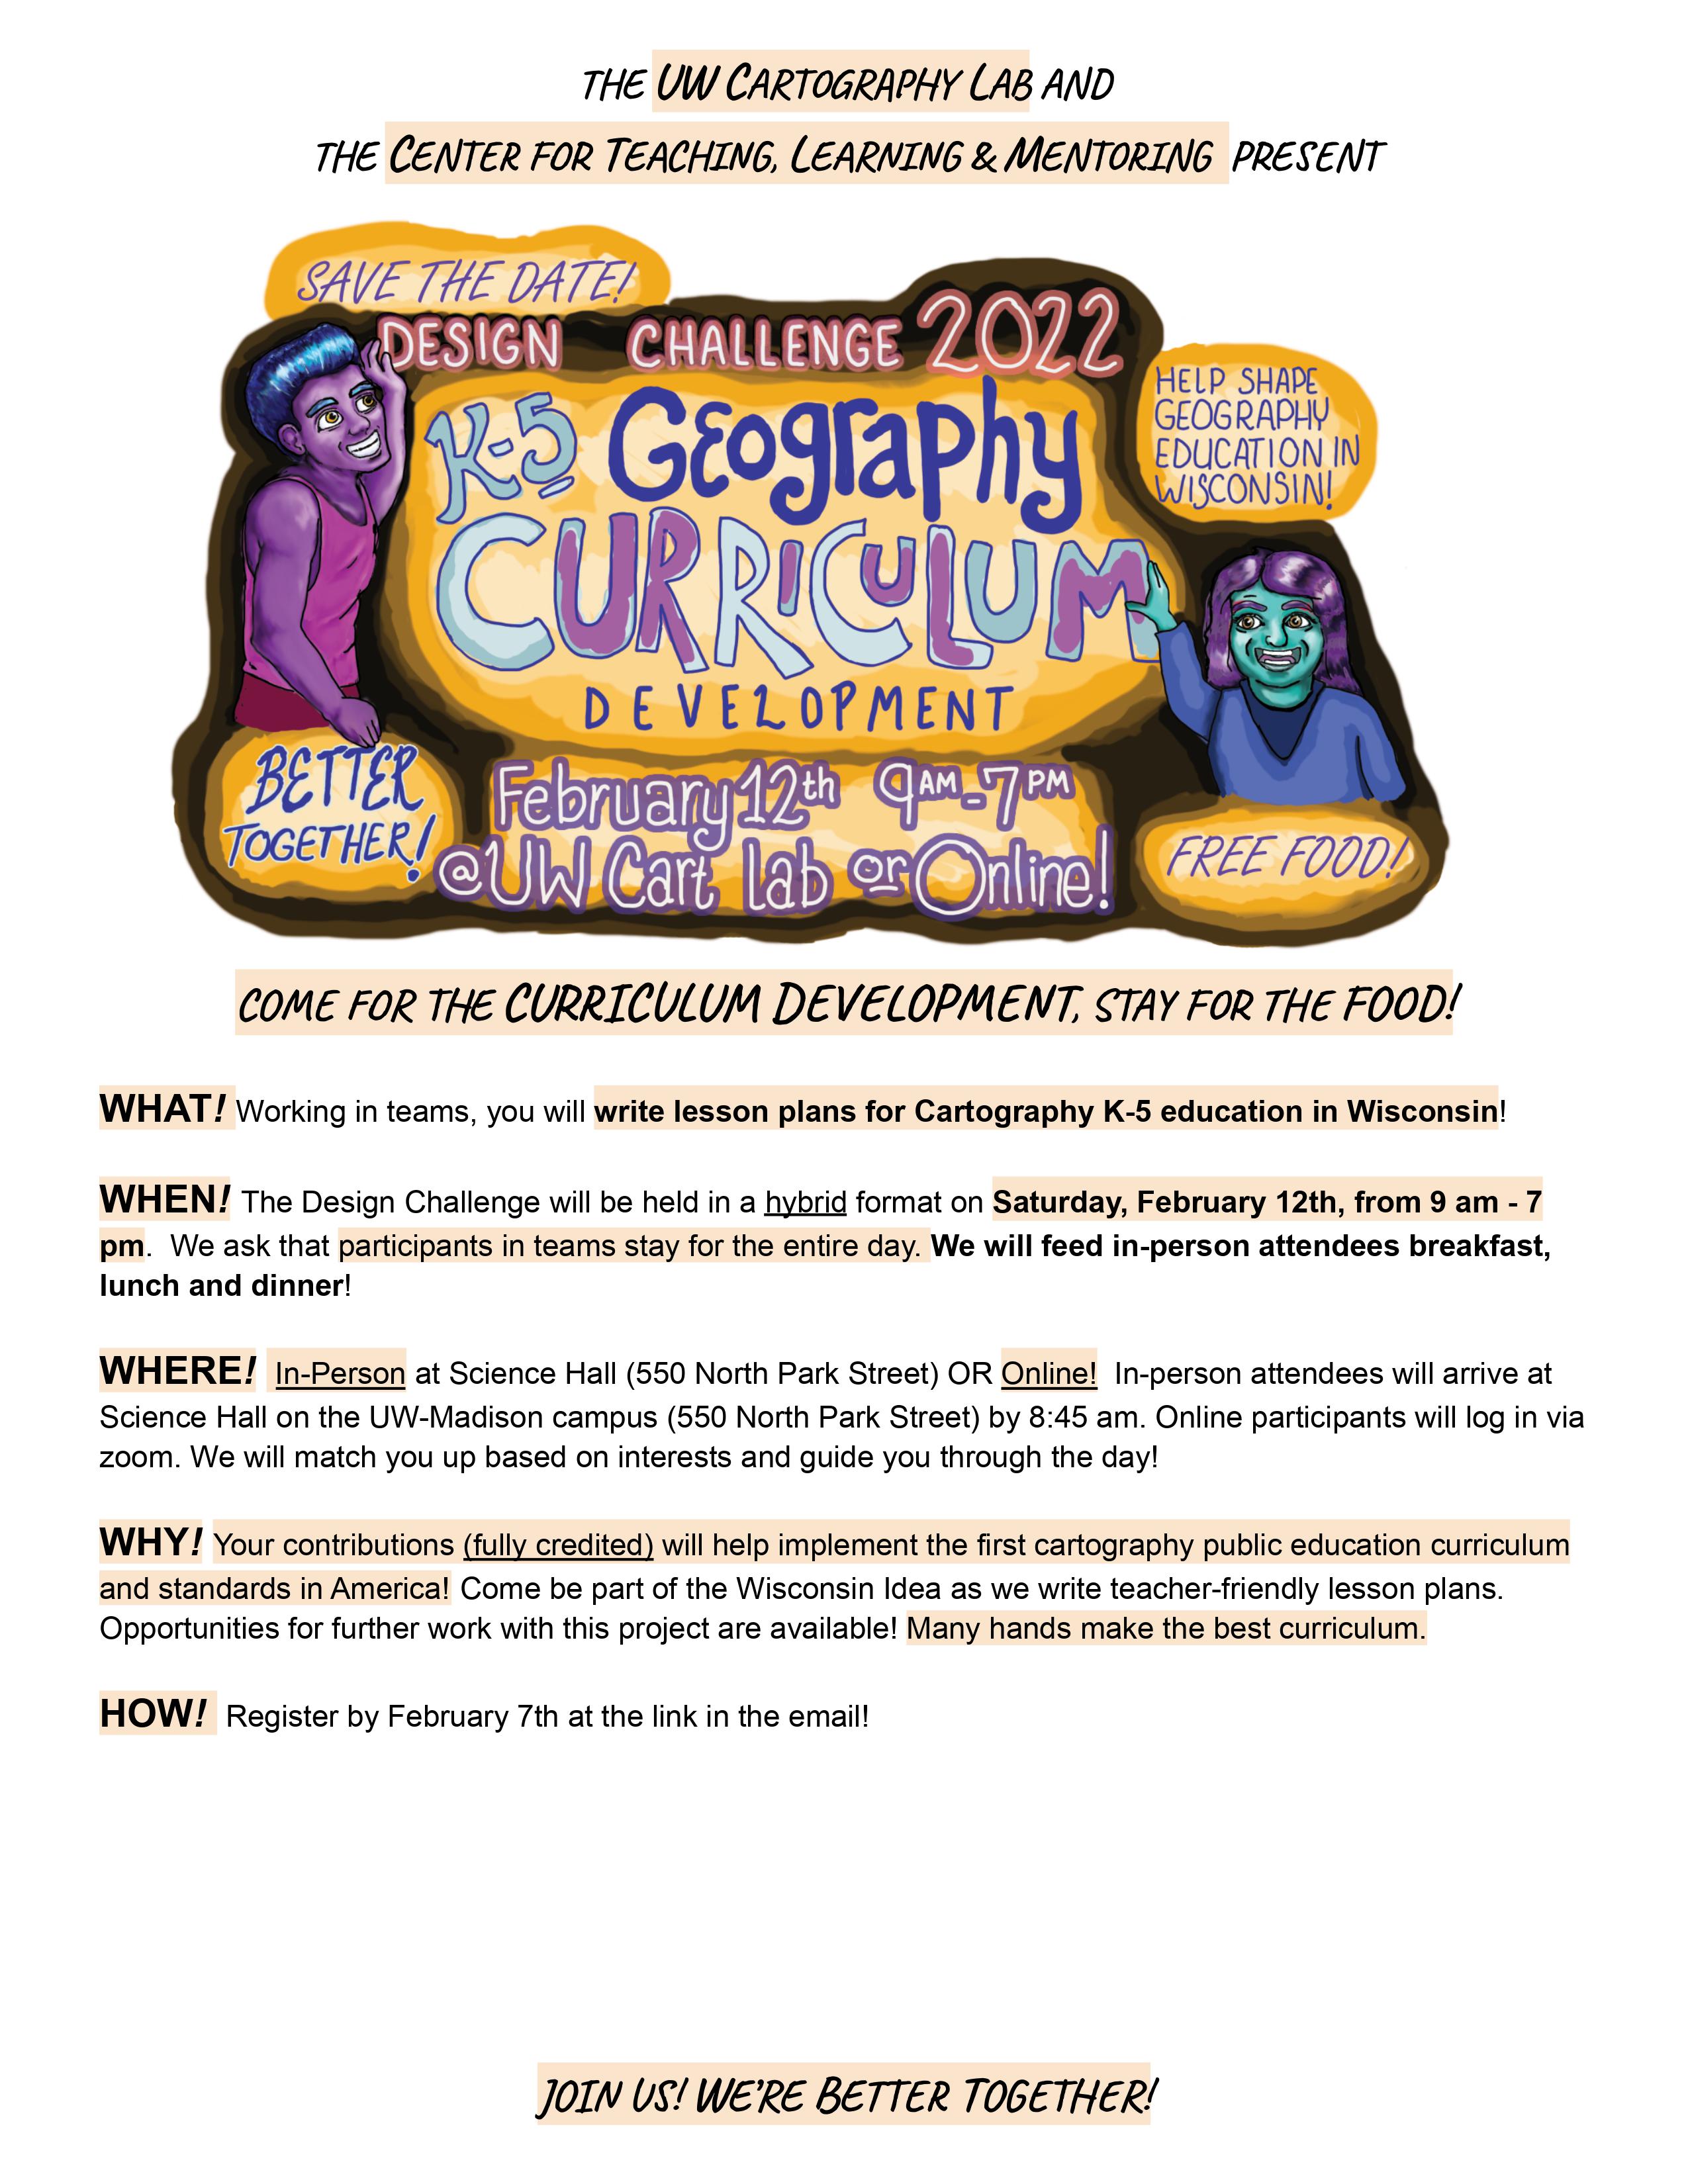
Participants designed cartography lesson plans for the new cartography K-5 educational standards. These lesson plans addressed five learning outcomes that shape the planned cartography curriculum. The design context was critical for a successful lesson plan. Lesson plans had to meet the following criteria: 1. Support learning outcomes, 2. Accessible without cartography training, and 3. Fit classroom needs. Volunteer subject matter experts from Center for Teaching, Learning, and Mentoring and the UW School of Education worked closely with participants to share their knowledge of the classroom setting, providing real-time design feedback. The close collaboration between classroom experts and participants resulted in lesson plans reflecting K-5 student and teacher needs. Completed lesson plans will be credited and revised for inclusion in the K-5 cartography curriculum. The 2022 Design Challenge will serve as a model for future curriculum development events, including a planned workshop at the North American Cartographic Information Society (NACIS) meeting in Fall 2022.
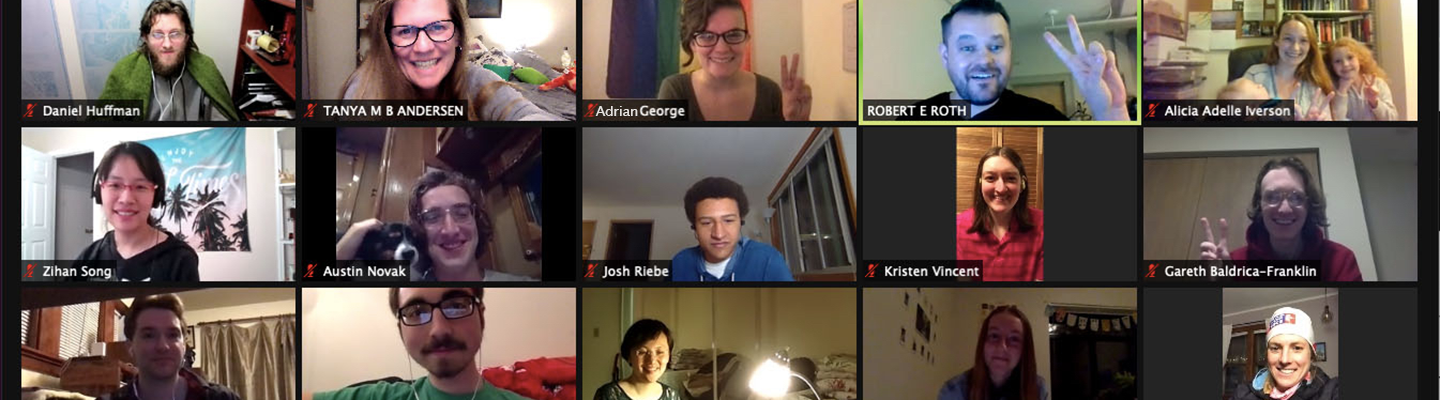
Our 2021 Design Challenge was completely virtual due to the COVID-19 pandemic. However, this virtual setting allowed us to include three alumni: Daniel Huffman, Zihan Song, and Kristen Vincent. Daniel provided the dataset: 180,000 line segments, representing the flight of 10,000 simulated birds over several months. Then, current students were divided into two teams, led by Zihan and Kristen, with the task of creatively representing this complex data. This design challenge occured over one week, each participant receiving one day to work. At the end of the day, they passed all files to the next team member in a relay style. Zihan and Kristen were assigned the final day, and then both groups presented over Zoom. The challenge proved an exciting opportunity for virtual collaboration and communication, as well as an opportunity for current students to network with alumni.
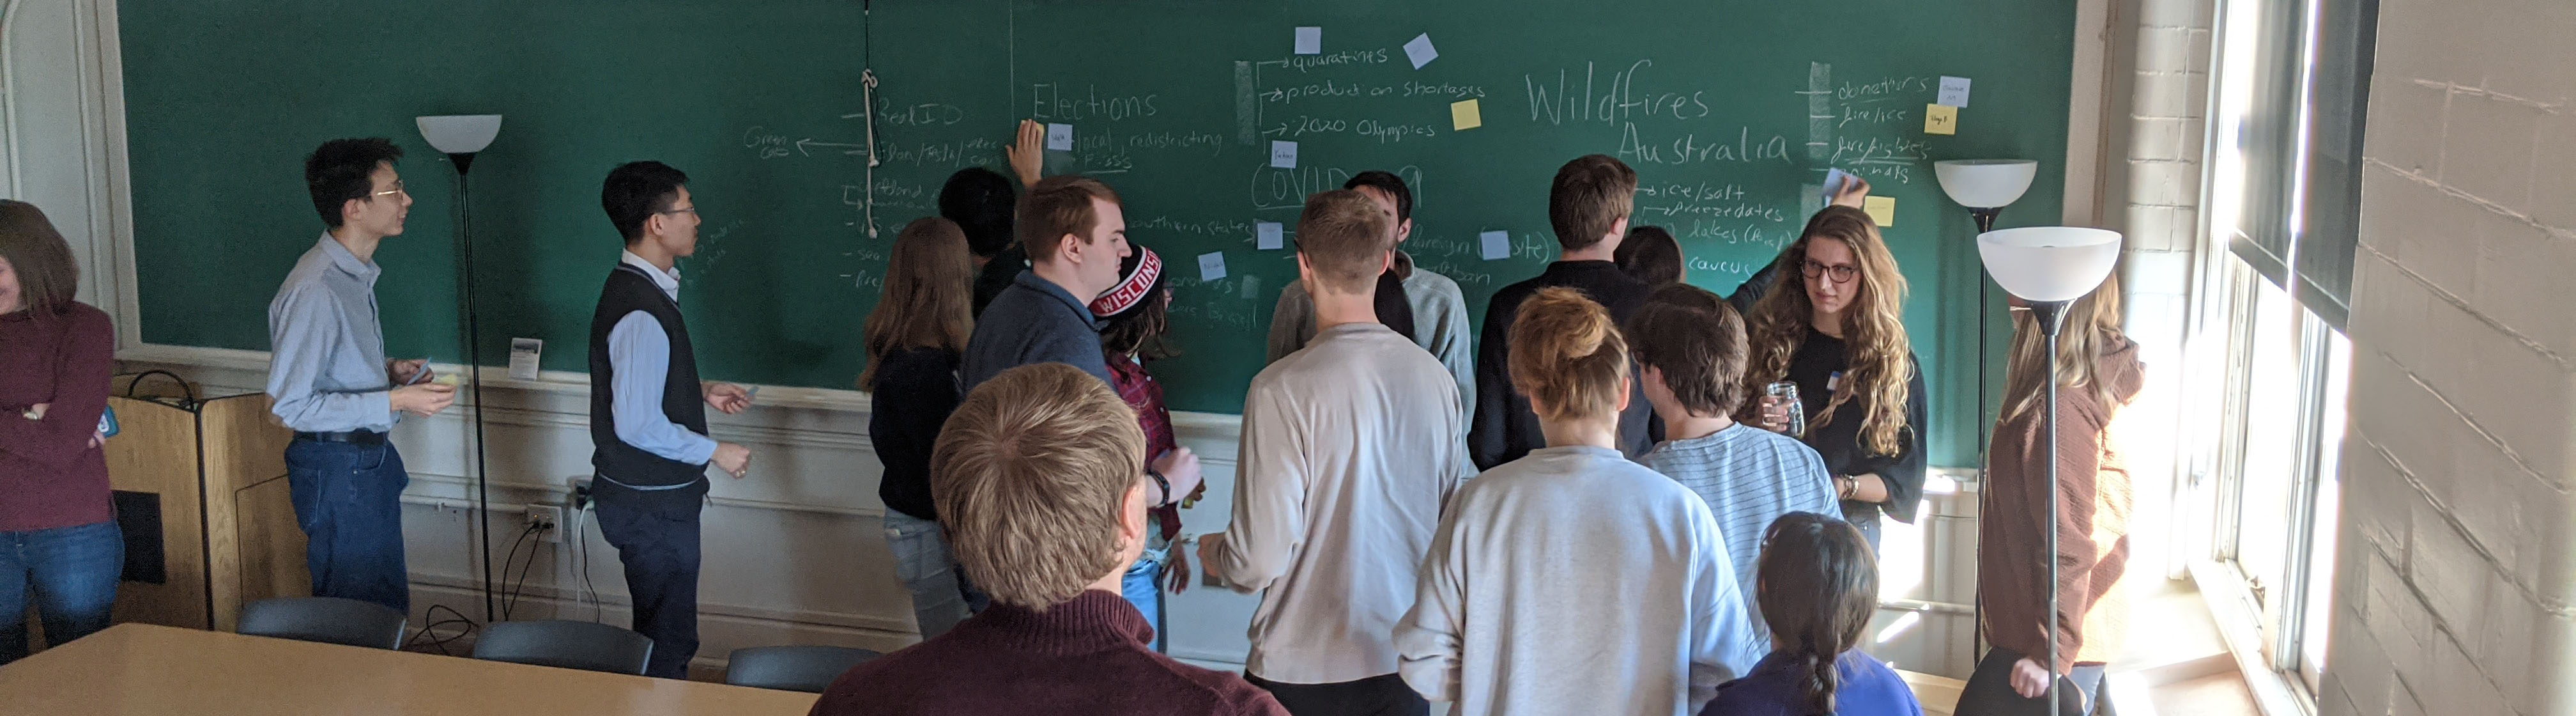
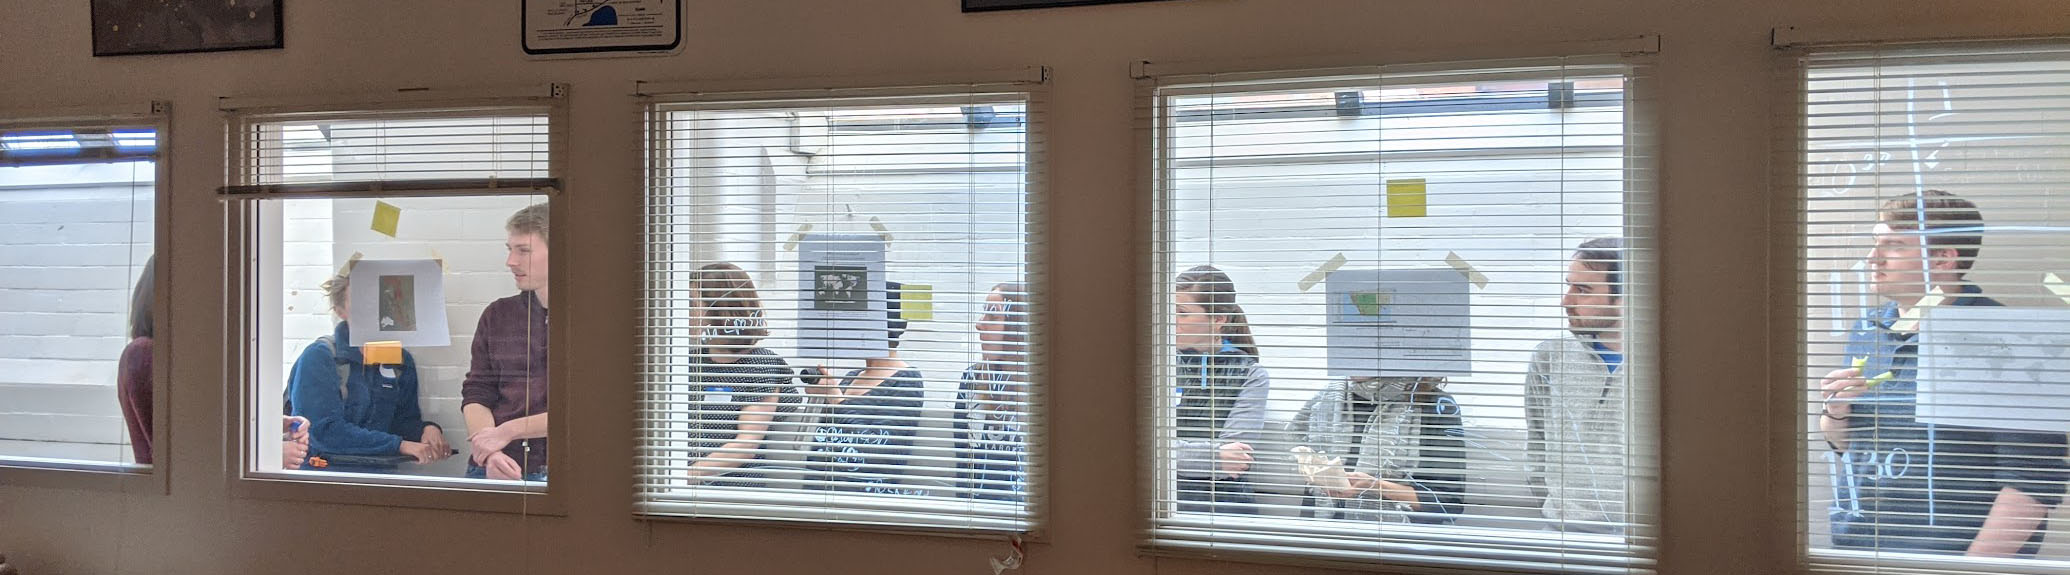
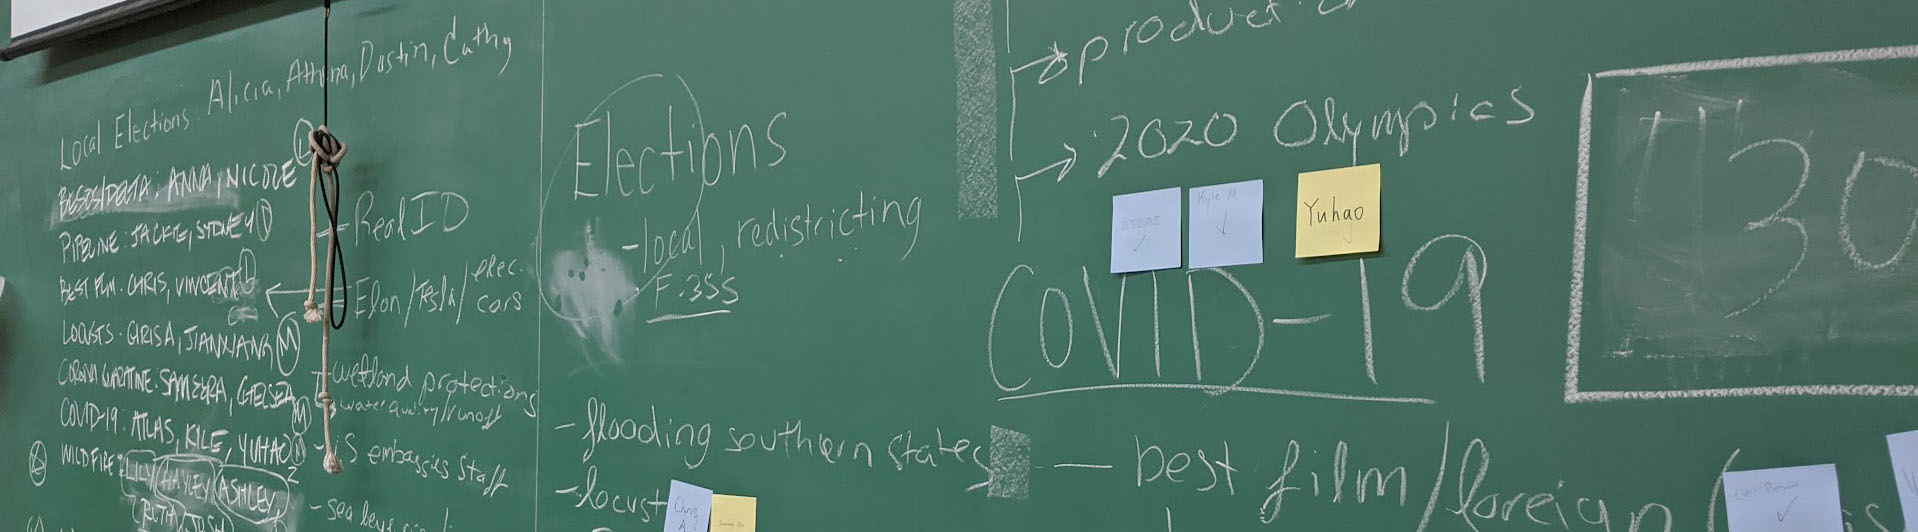
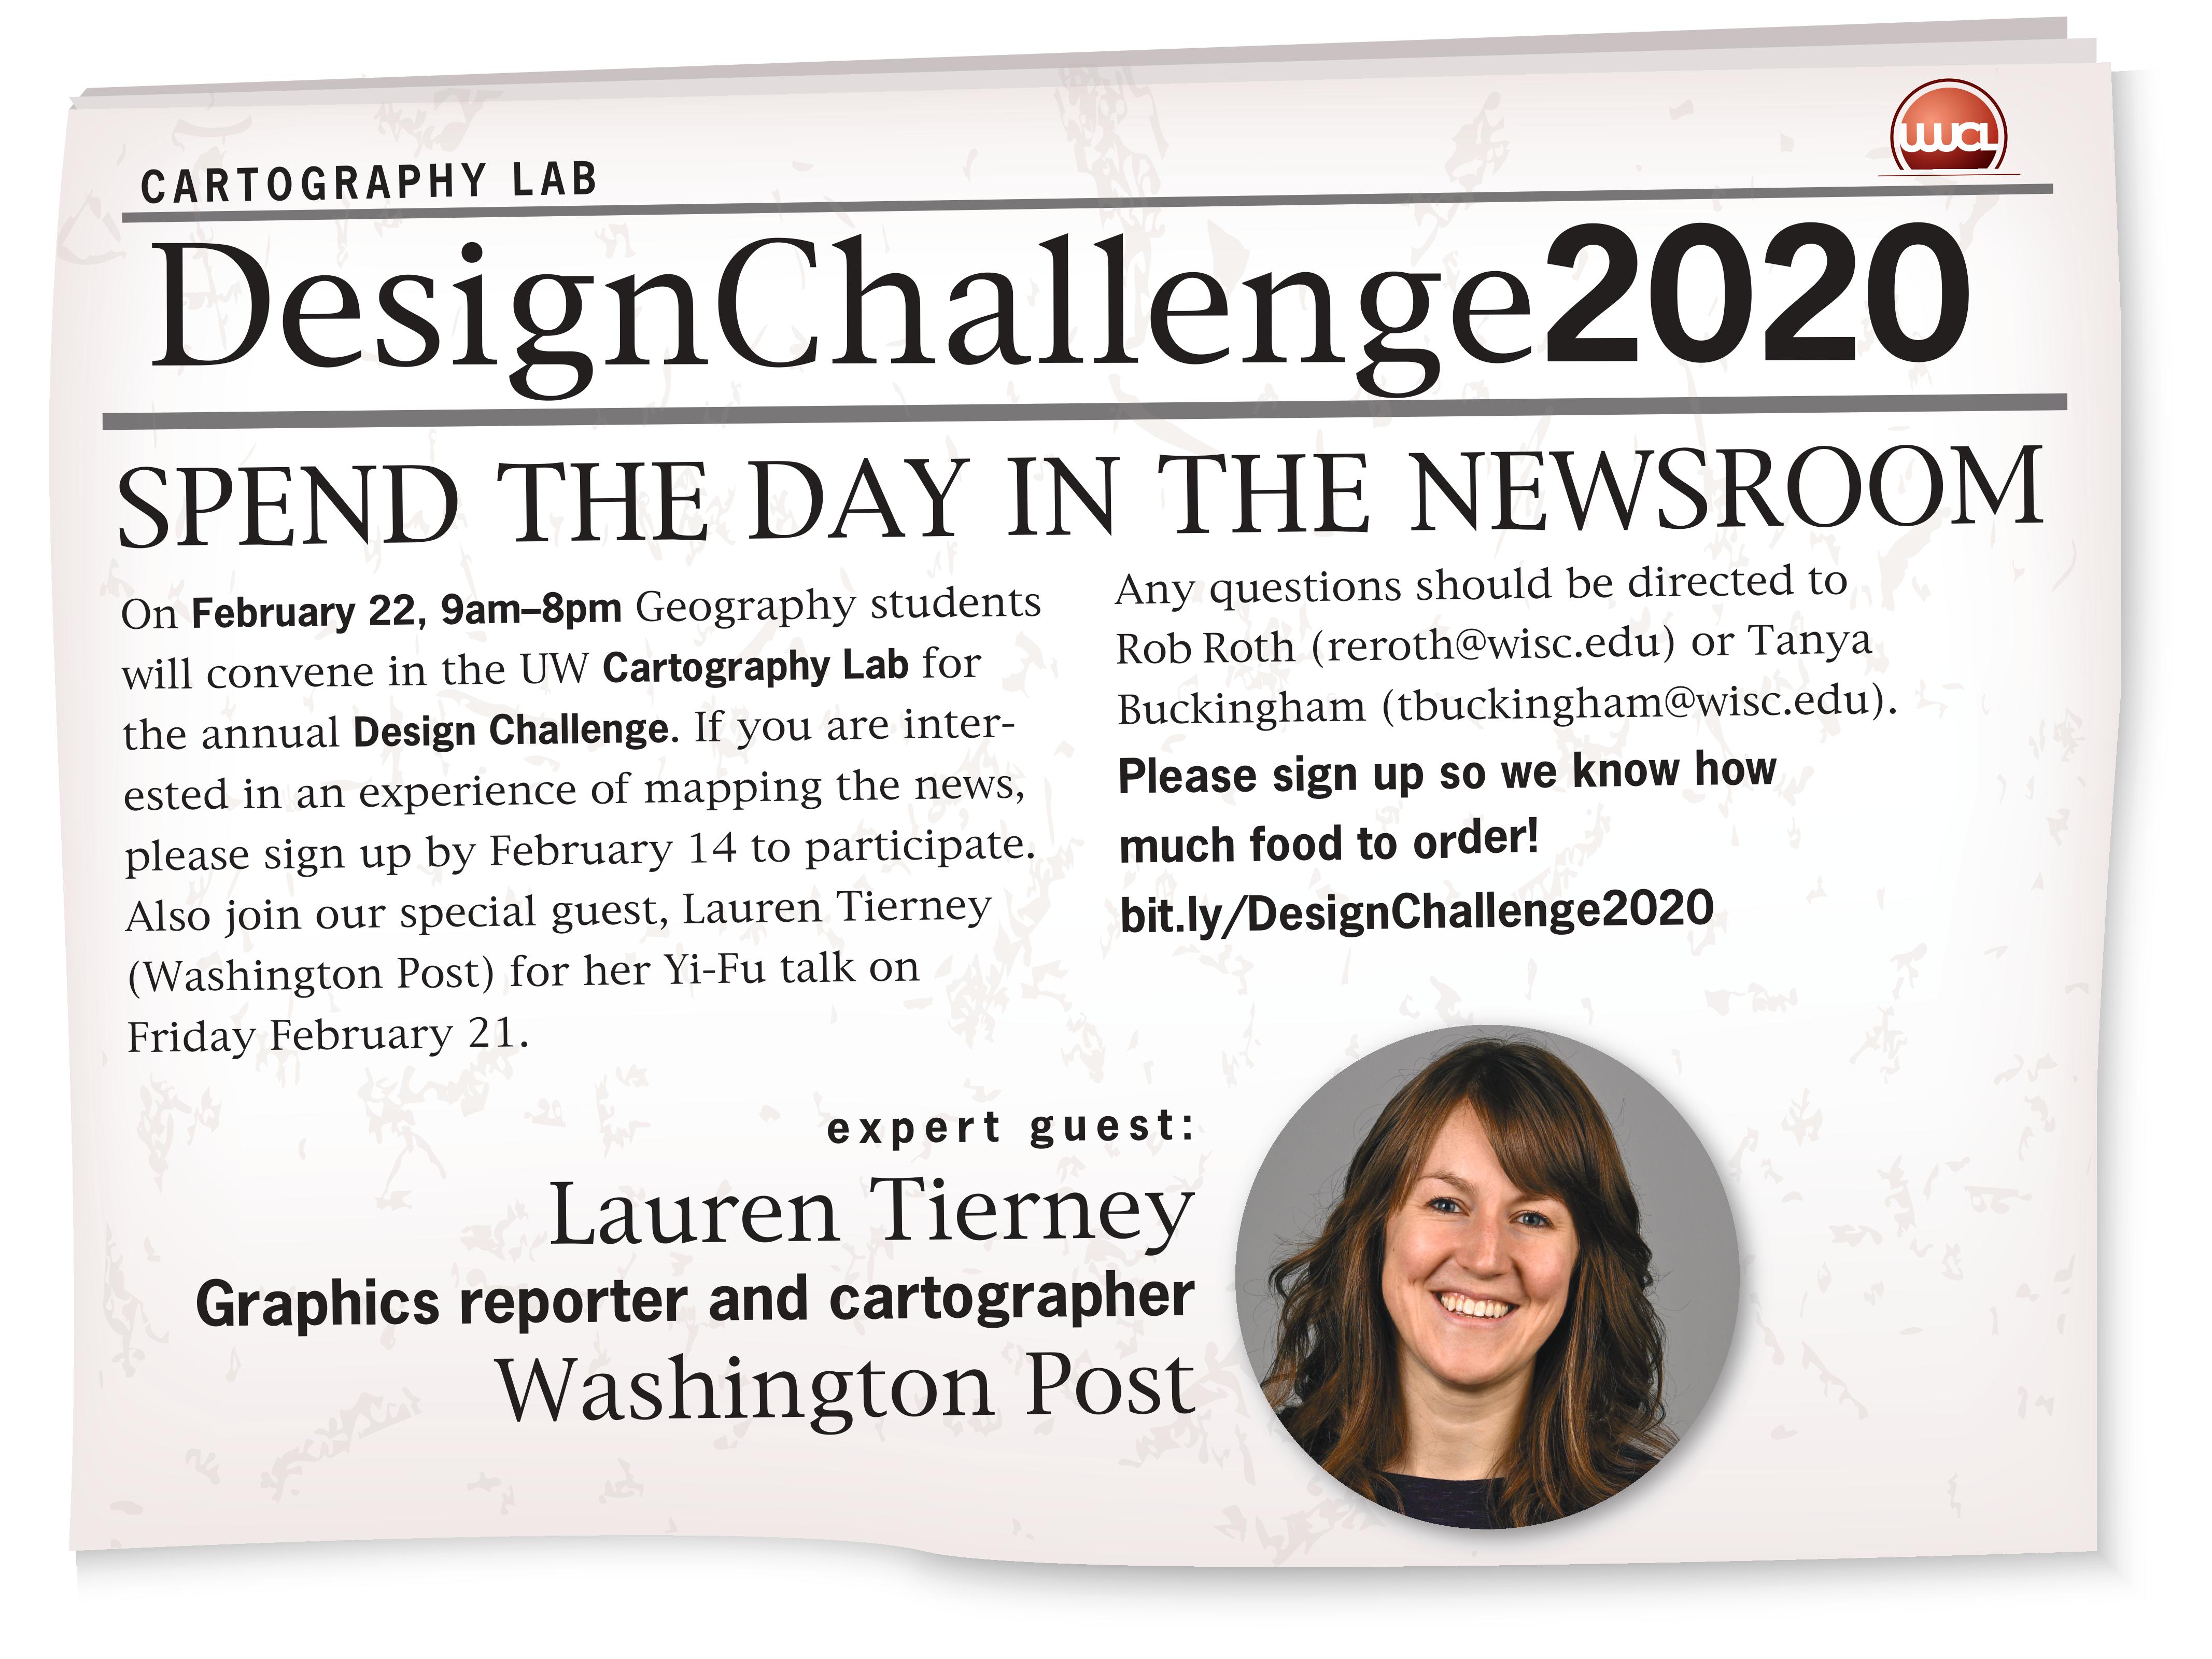
For the 2020 Design Challenge, we spent the day in the newsroom with Lauren Tierney, an award-winning graphics reporter and cartographer from the Washington Post (and formerly of National Geographic). In her job, Lauren covers an array of topics, from politics to climate change to natural disasters, all of which involve conveying complex information to a broad audience. Here, we simulated the newsroom experience, telling a complex story in limited time. Each team covered a different topic, complete with breaks for peer review.
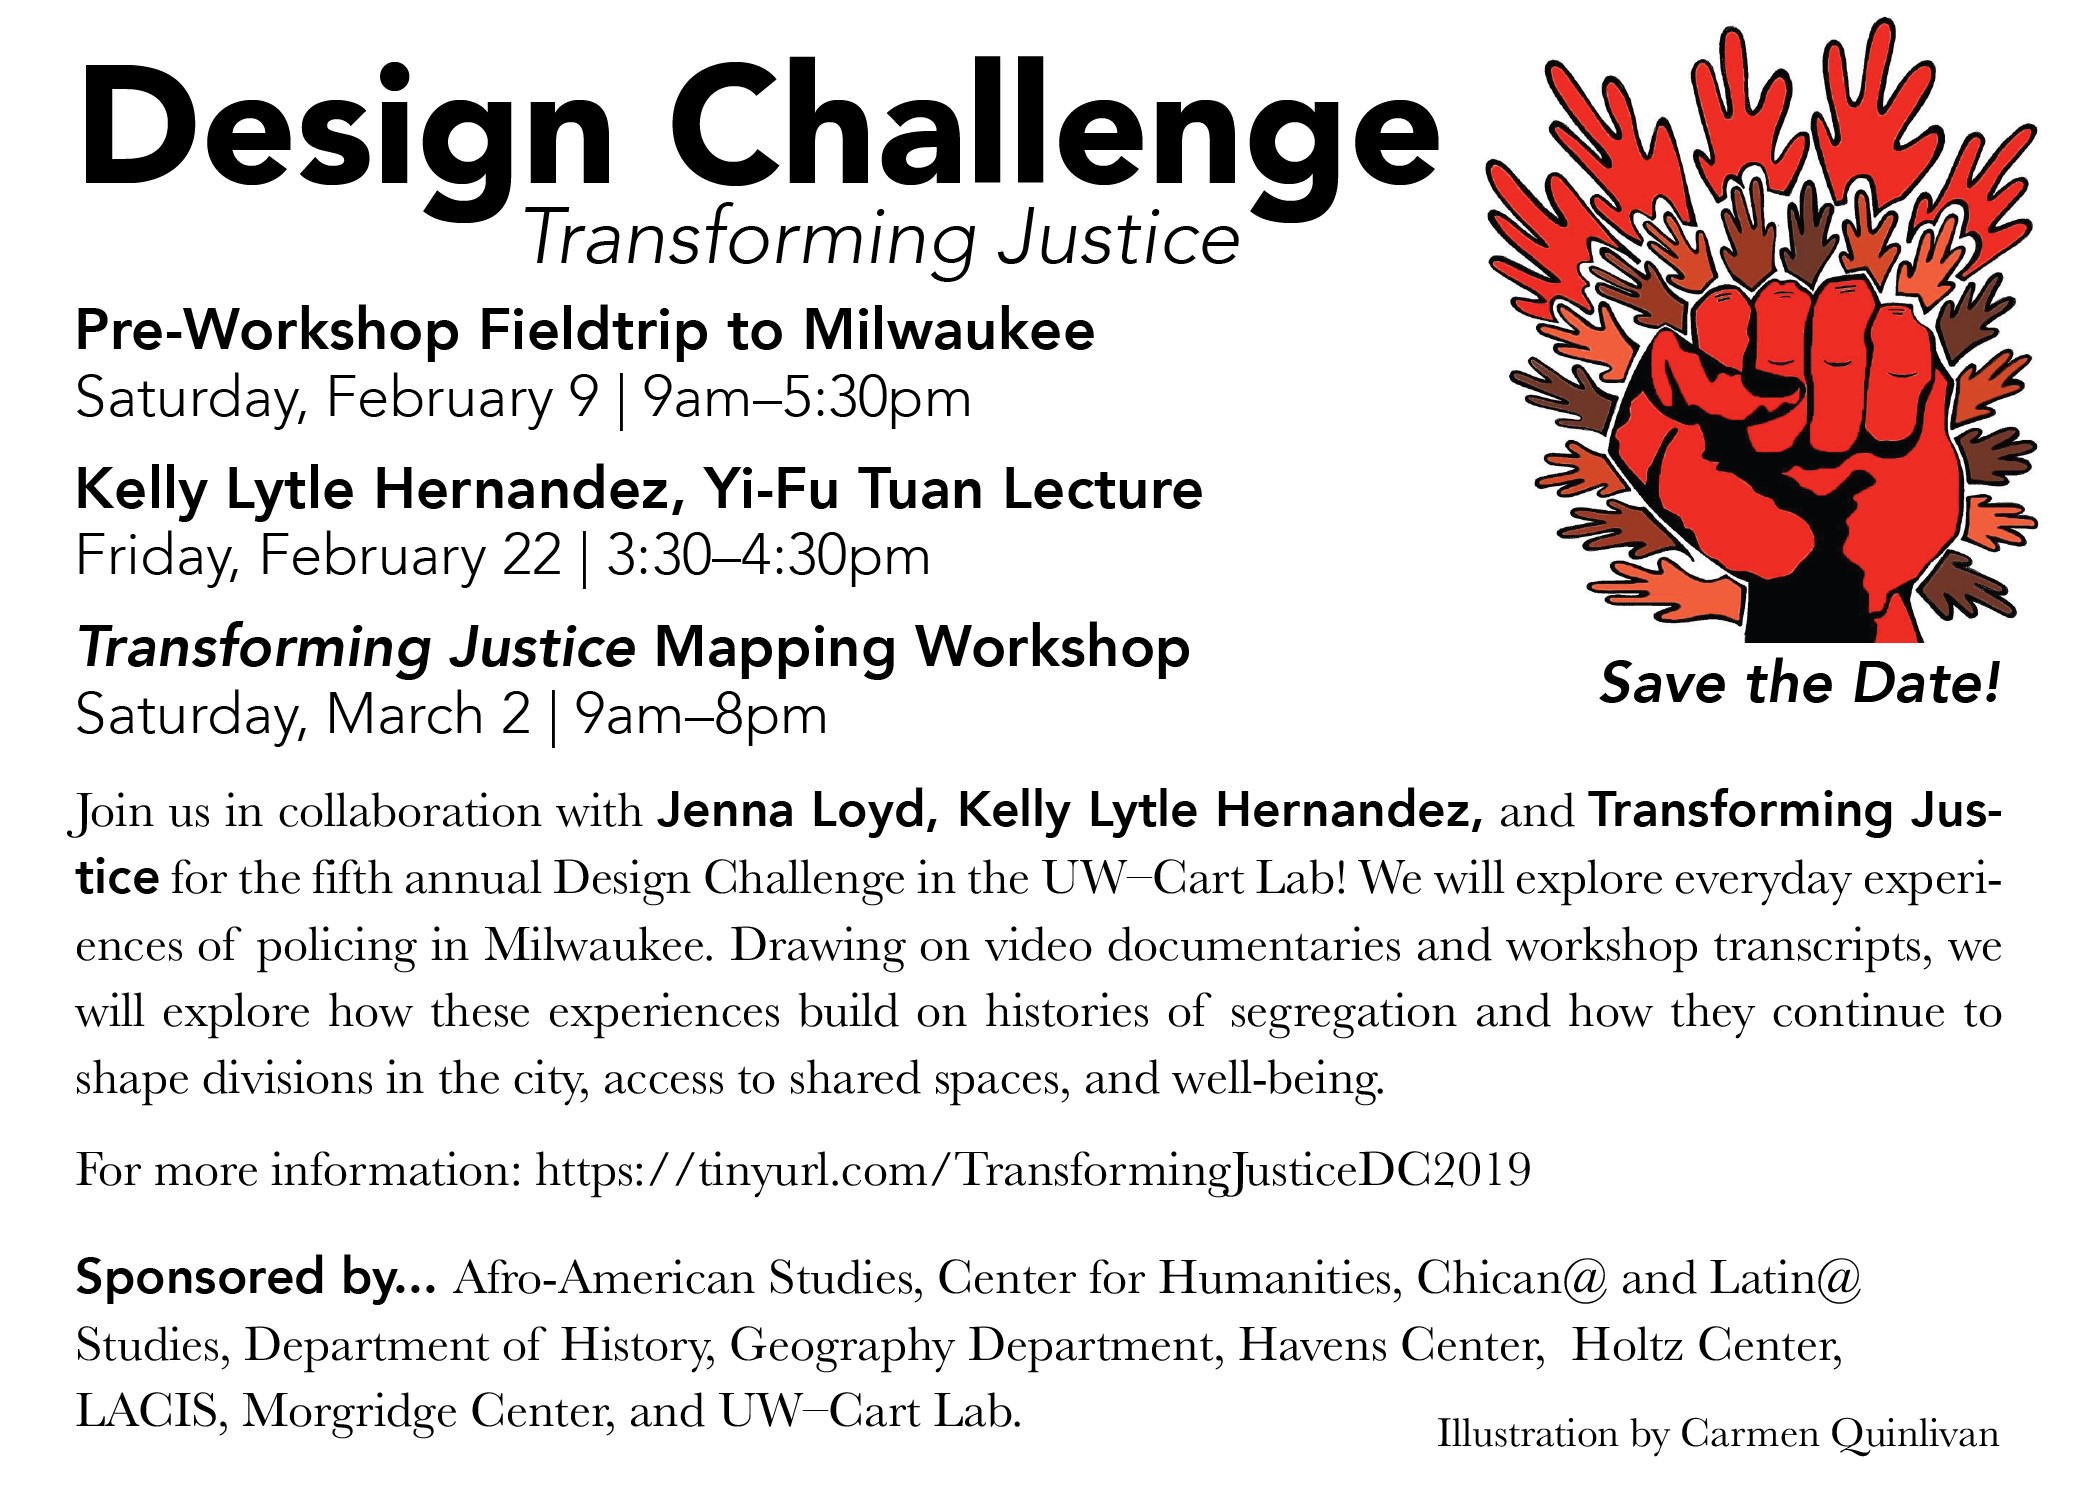
In collaboration with Jenna Loyd, Kelly Lytle Hernandez, and Transforming Justice, this year's Design Challenge will explore everyday experiences of policing in Milwaukee. Drawing on video documentaries and workshop transcripts, we will explore how these experiences build on histories of segregation and how they continue to shape divisions in the city, access to shared spaces, and well-being.
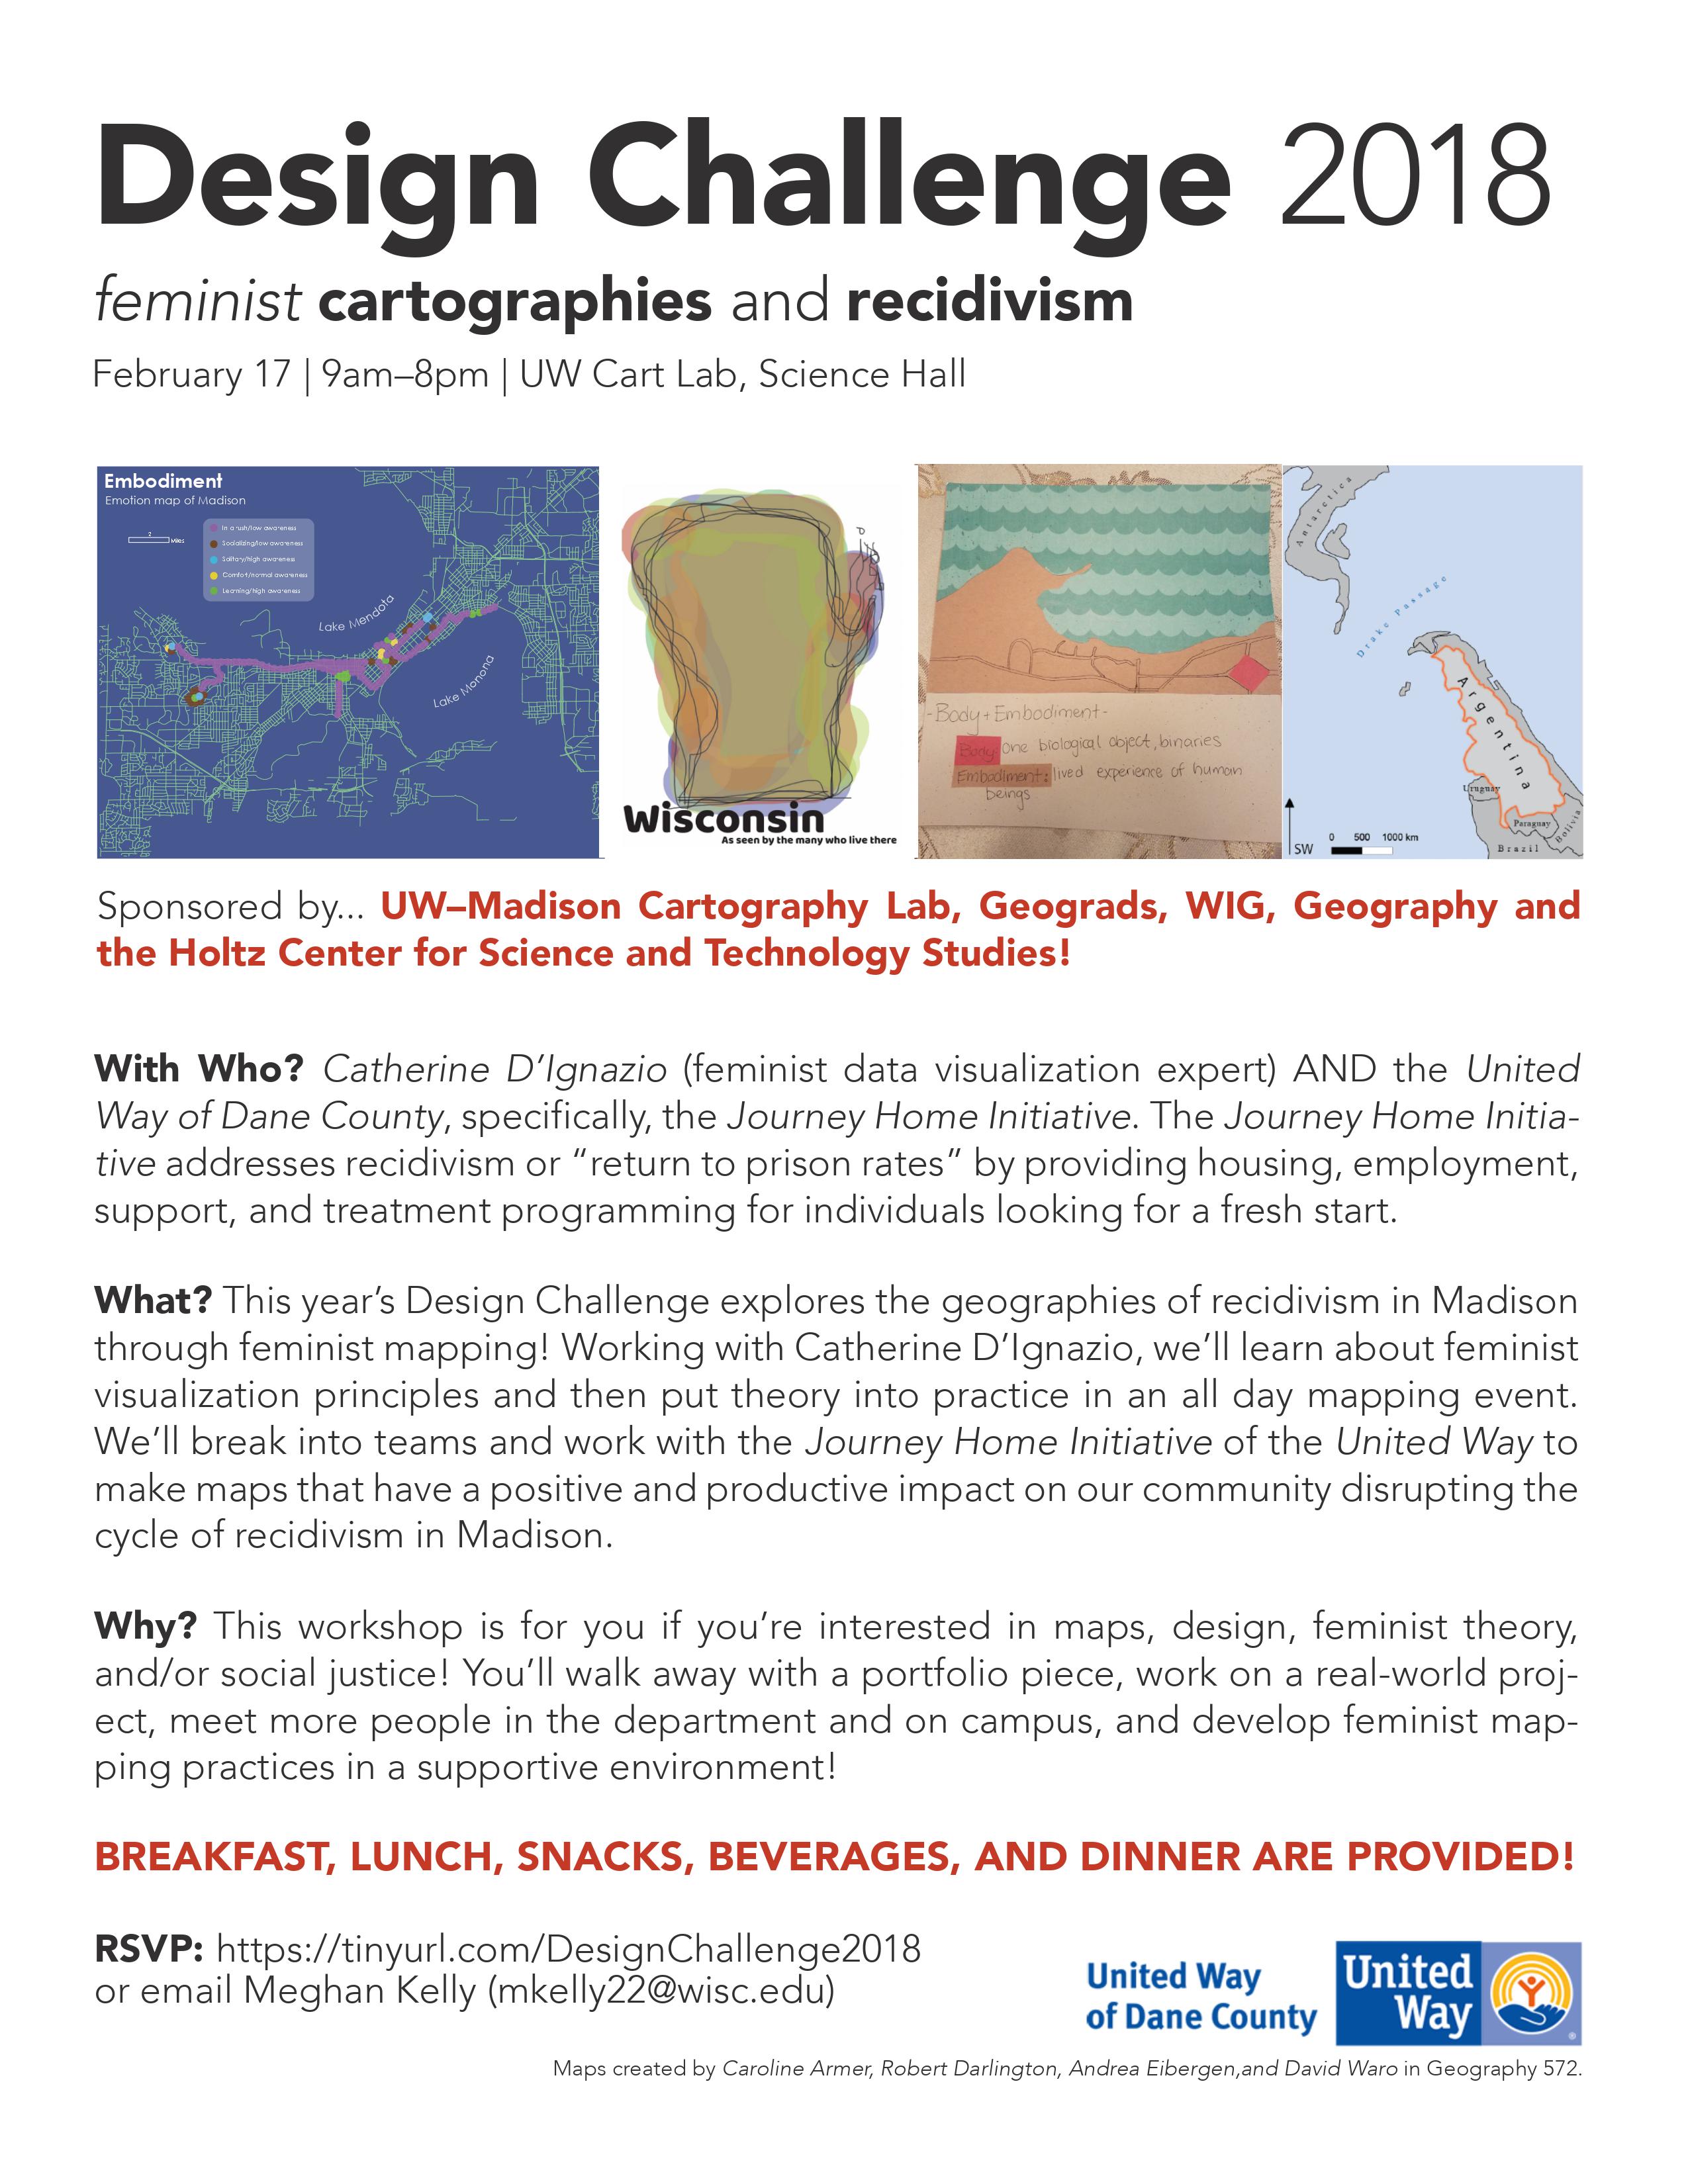
Last year's Design Challenge explored the geographies of recidivism in Madison through feminist mapping! Working Catherine D’Ignazio, we learned about feminist visualization principles and then put theory into practice in an all day mapping event. In teams, we worked with the Journey Home Initiative of the United Way of Dane County to make maps that have a positive and productive impact on our community disrupting the cycle of recidivism in Madison.
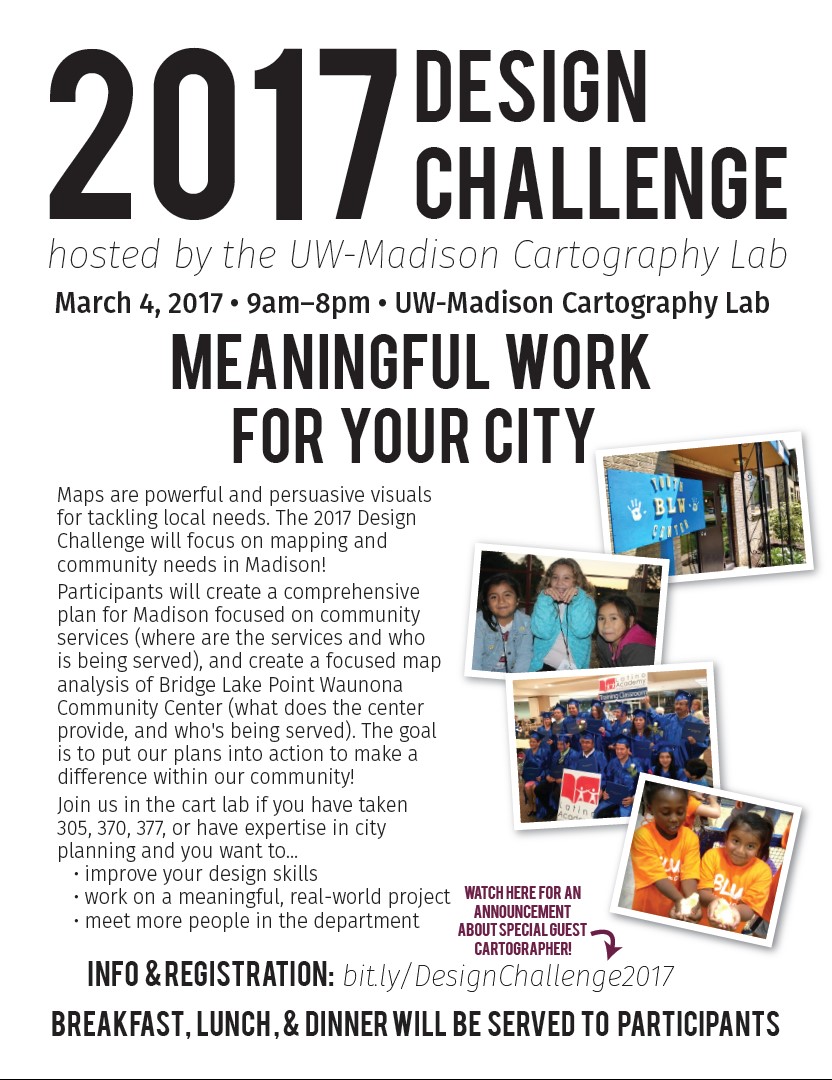
Maps are powerful and persuasive visuals for tackling local needs. The 2017 Design Challenge will focus on mapping and community needs in Madison! Participants will create a comprehensive plan for Madison focused on community services (where are the services and who is being served), and create a focused map analysis of Bridge Lake Point Waunona Community Center (what does the center provide, and who's being served). The goal is to put our plans into action to make a difference within our community!
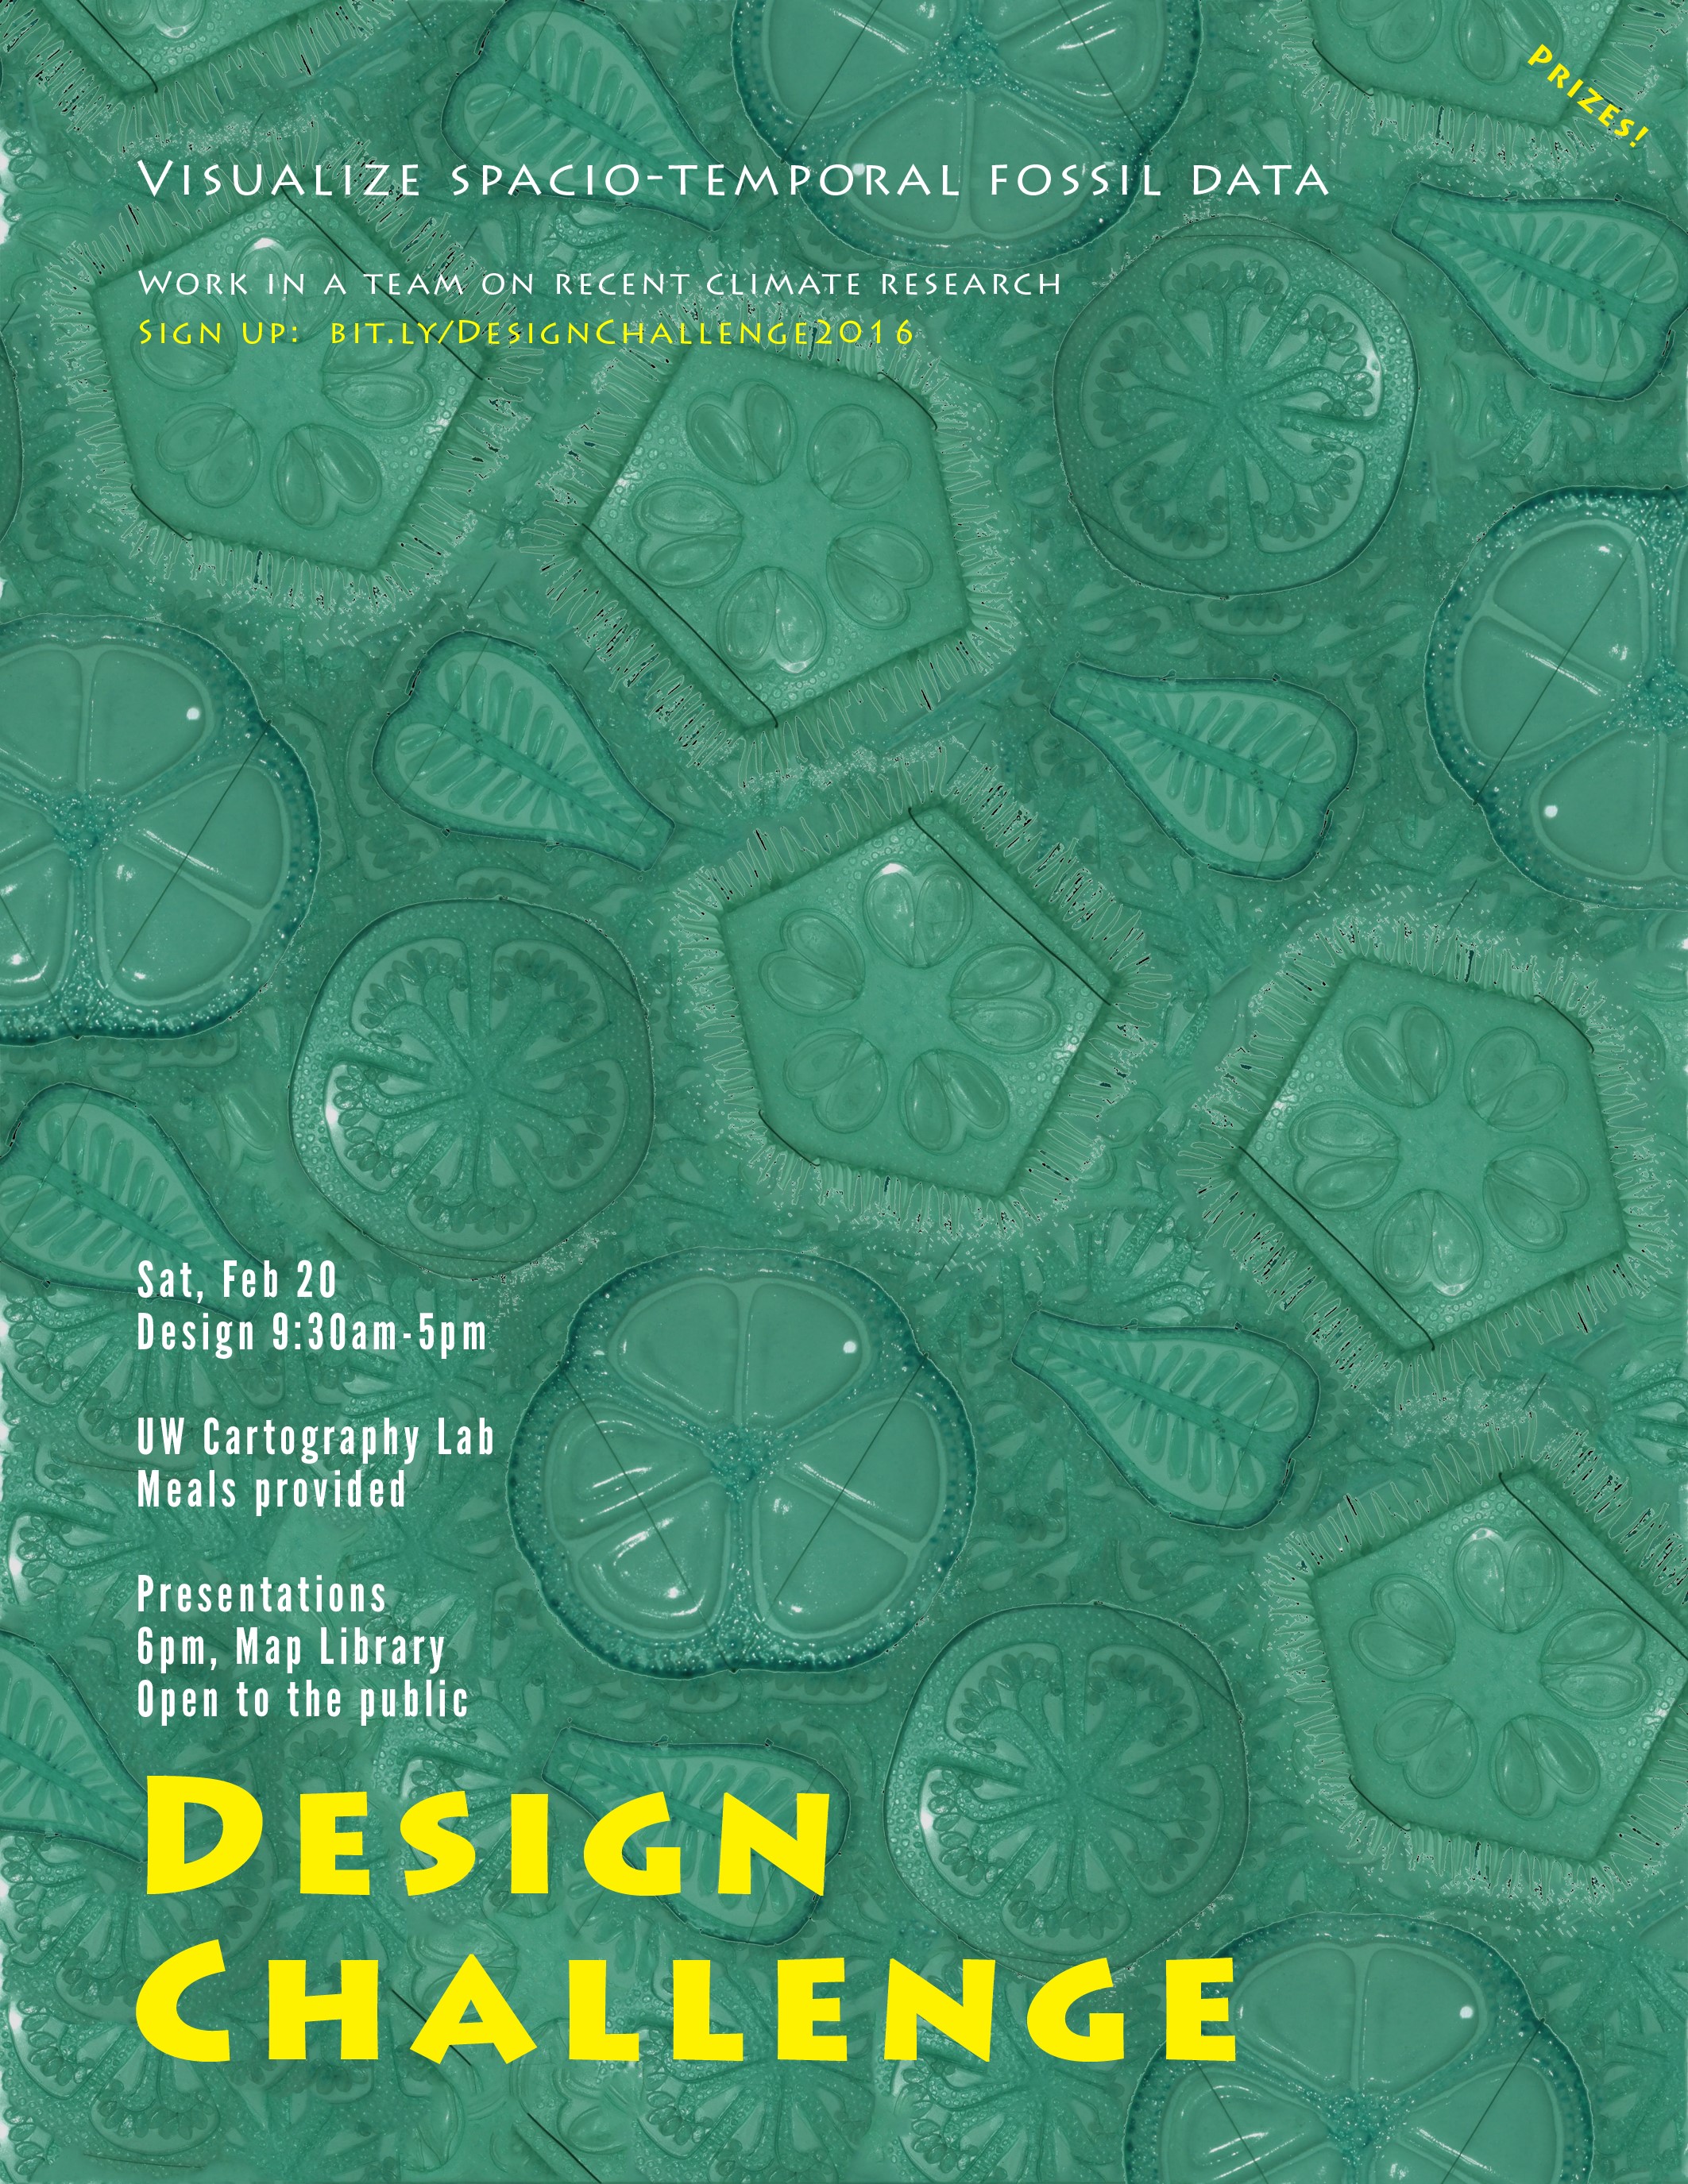
For this second annual Design Challenge, students generated new insight from fossil records in North America. They developed unique visualizations to facilitate communication of trends in multidimensional spatio-temporal data.
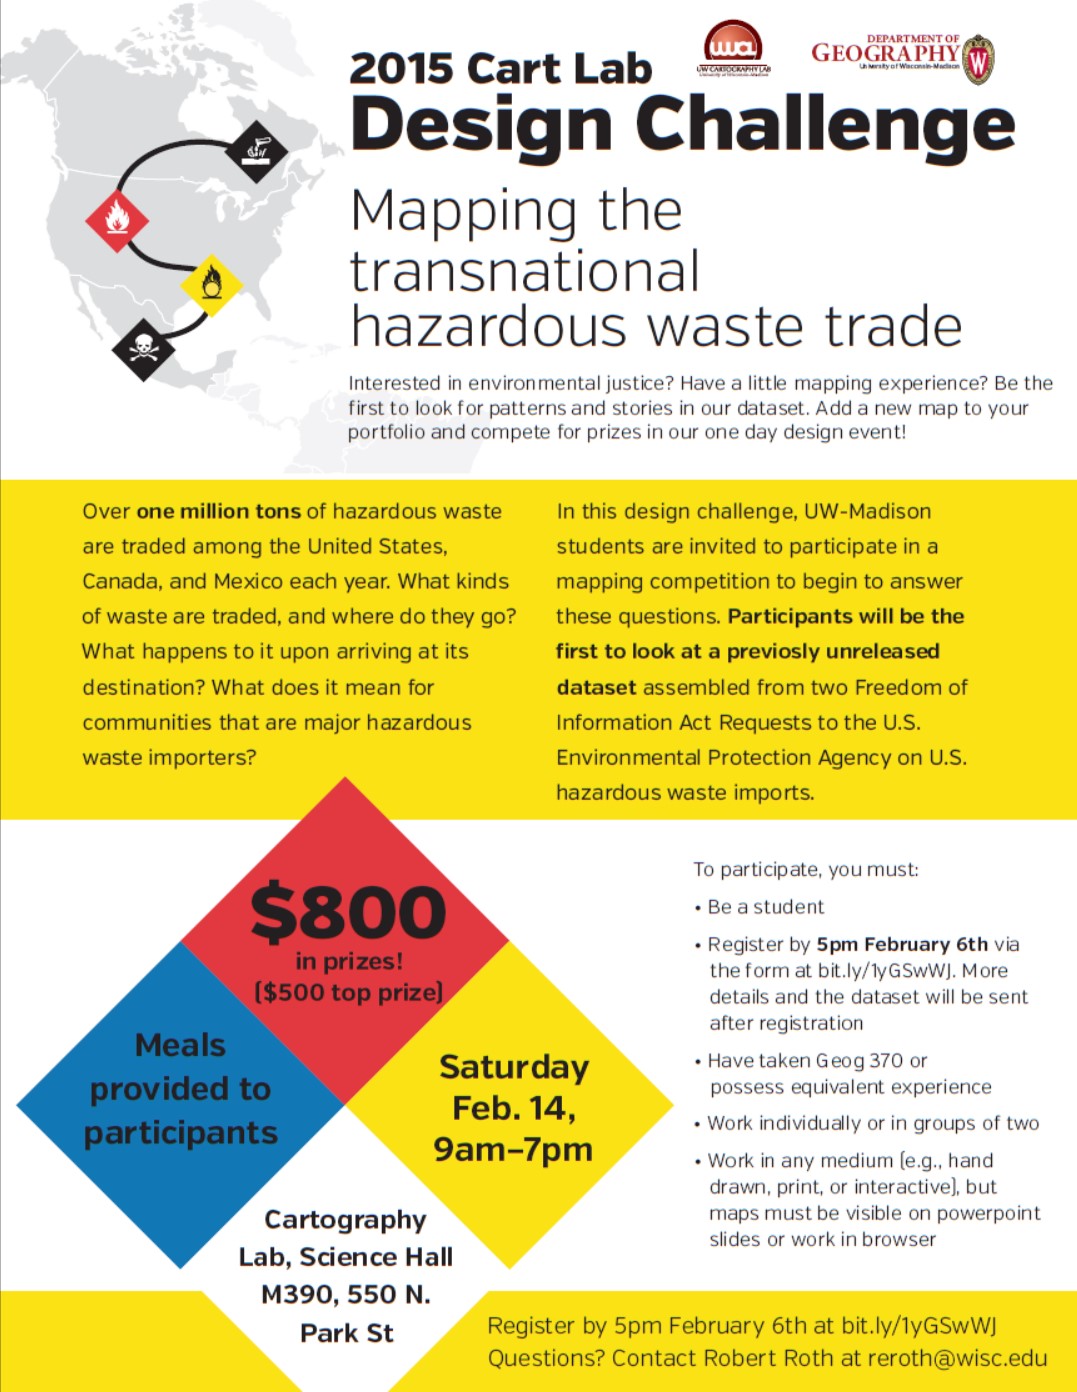
Eighteen geography students spent their Valentine’s Day wading through a complicated, real-world dataset, to create data visualizations that will help researchers better understand the hazardous waste trade in North America. Dr. Sarah Moore obtained EPA records of transnational trade of hazardous waste through a pair of Freedom of Information Act requests. The data are big and messy, and real. They arrived as scans of shipping labels, which had to be coded. Students over the course of two semesters have worked to code the data, putting it into a format that can be analyzed. With a little over a quarter of the data entered, it was time to start digging around to see what stories could be unearthed.
Curriculum Overview
G370: Introduction to Cart
G572: Graphic Design
G575: Interactive Cart
G970: Cartography Seminar
Web Mapping Workbook
Mapping for a Sustainable World Textbook
QGIS Open Source Tutorials
Design Challenge
Cart Lab Education Series (CLES)
Educational Resources
Github Projects
Contact Us