Abstract: Play benefits childhood development and well-being, and is a key factor in sustainable city design. Though previous studies have examined the effects of various urban features on how much children play and where they play, such studies rely on quantitative measurements of play such as the precise location of play and the duration of play time, while people’s subjective feelings regarding the playability of their environment are overlooked. In this study, we capture people’s perception of place playability by employing Amazon Mechanical Turk (MTurk) to classify street view images. A deep learning model trained on the labelled data is then used to evaluate neighborhood playability for three U.S. cities: Boston, Seattle, and San Francisco. Finally, multivariate and geographically weighted regression models are used to explore how various urban features are associated with playability. We find that higher traffic speeds and crime rates are negatively associated with playability, while higher scores for perception of beauty are positively associated with playability. Interestingly, a place that is perceived as lively may not be playable. Our research provides helpful insights for urban planning focused on sustainable city growth and development, as well as for research focused on creating nourishing environments for child development.
Highlighted results:
Our deep learning model was able to produce playability scores whose distribution closely matched that of the training data.
Using images labeled by our deep learning model, we produced a map of playability scores for Boston, Seattle, and San Francisco.
Downtown areas in the three cities studied had high lively scores but low playability scores.
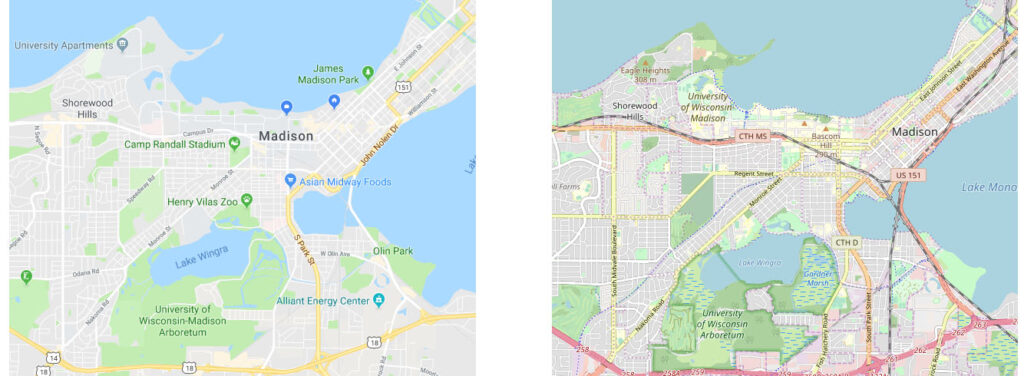
This paper proposes a methodology framework to transfer the cartographic style in different kinds of maps. By inputting the raw GIS vector data, the system can automatically render styles to the input data with target map styles but without CartoCSS or MapboxGL style specification sheets. The Generative Adversarial Networks (GANs) are used in this research. The study explores the potential of implementing artificial intelligence in cartography in the era of GeoAI.
We outline several important directions for the use of AI in cartography moving forward. First, our use of GANs can be extended to other mapping contexts to help cartographers deconstruct the most salient stylistic elements that constitute the unique look and feel of existing designs, using this information to improve design in future iterations. This research also can help nonexperts who lack professional cartographic knowledge and experience to generate reasonable cartographic style sheet templates based on inspiration maps or visual art. Finally, integration of AI with cartographic design may automate part of the generalization process, a particularly promising avenue given the difficult of updating high resolution datasets and rendering new tilesets to support the ’map of everywhere’.
Here is the abstract:
The advancement of the Artificial Intelligence (AI) technologies makes it possible to learn stylistic design criteria from existing maps or other visual arts and transfer these styles to make new digital maps. In this paper, we propose a novel framework using AI for map style transfer applicable across multiple map scales. Specifically, we identify and transfer the stylistic elements from a target group of visual examples, including Google Maps, OpenStreetMap, and artistic paintings, to unstylized GIS vector data through two generative adversarial network (GAN) models. We then train a binary classifier based on a deep convolutional neural network to evaluate whether the transfer styled map images preserve the original map design characteristics. Our experiment results show that GANs have a great potential for multiscale map style transferring, but many challenges remain requiring future research.
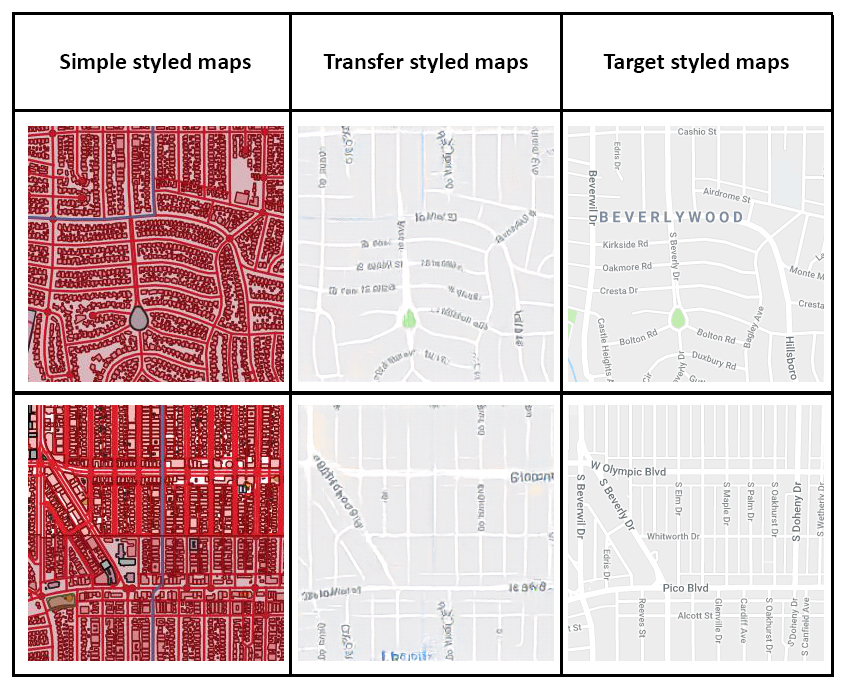
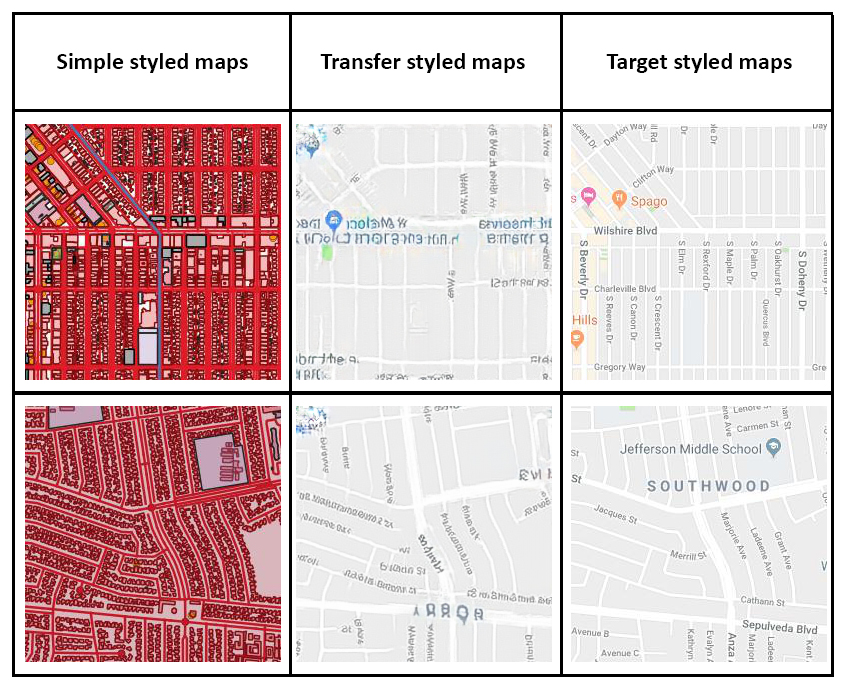
Examples of Map Style Transfer using Pix2Pix Examples of Map Style Transfer using CycleGAN
You can also visit the following links to see some of the trained results:
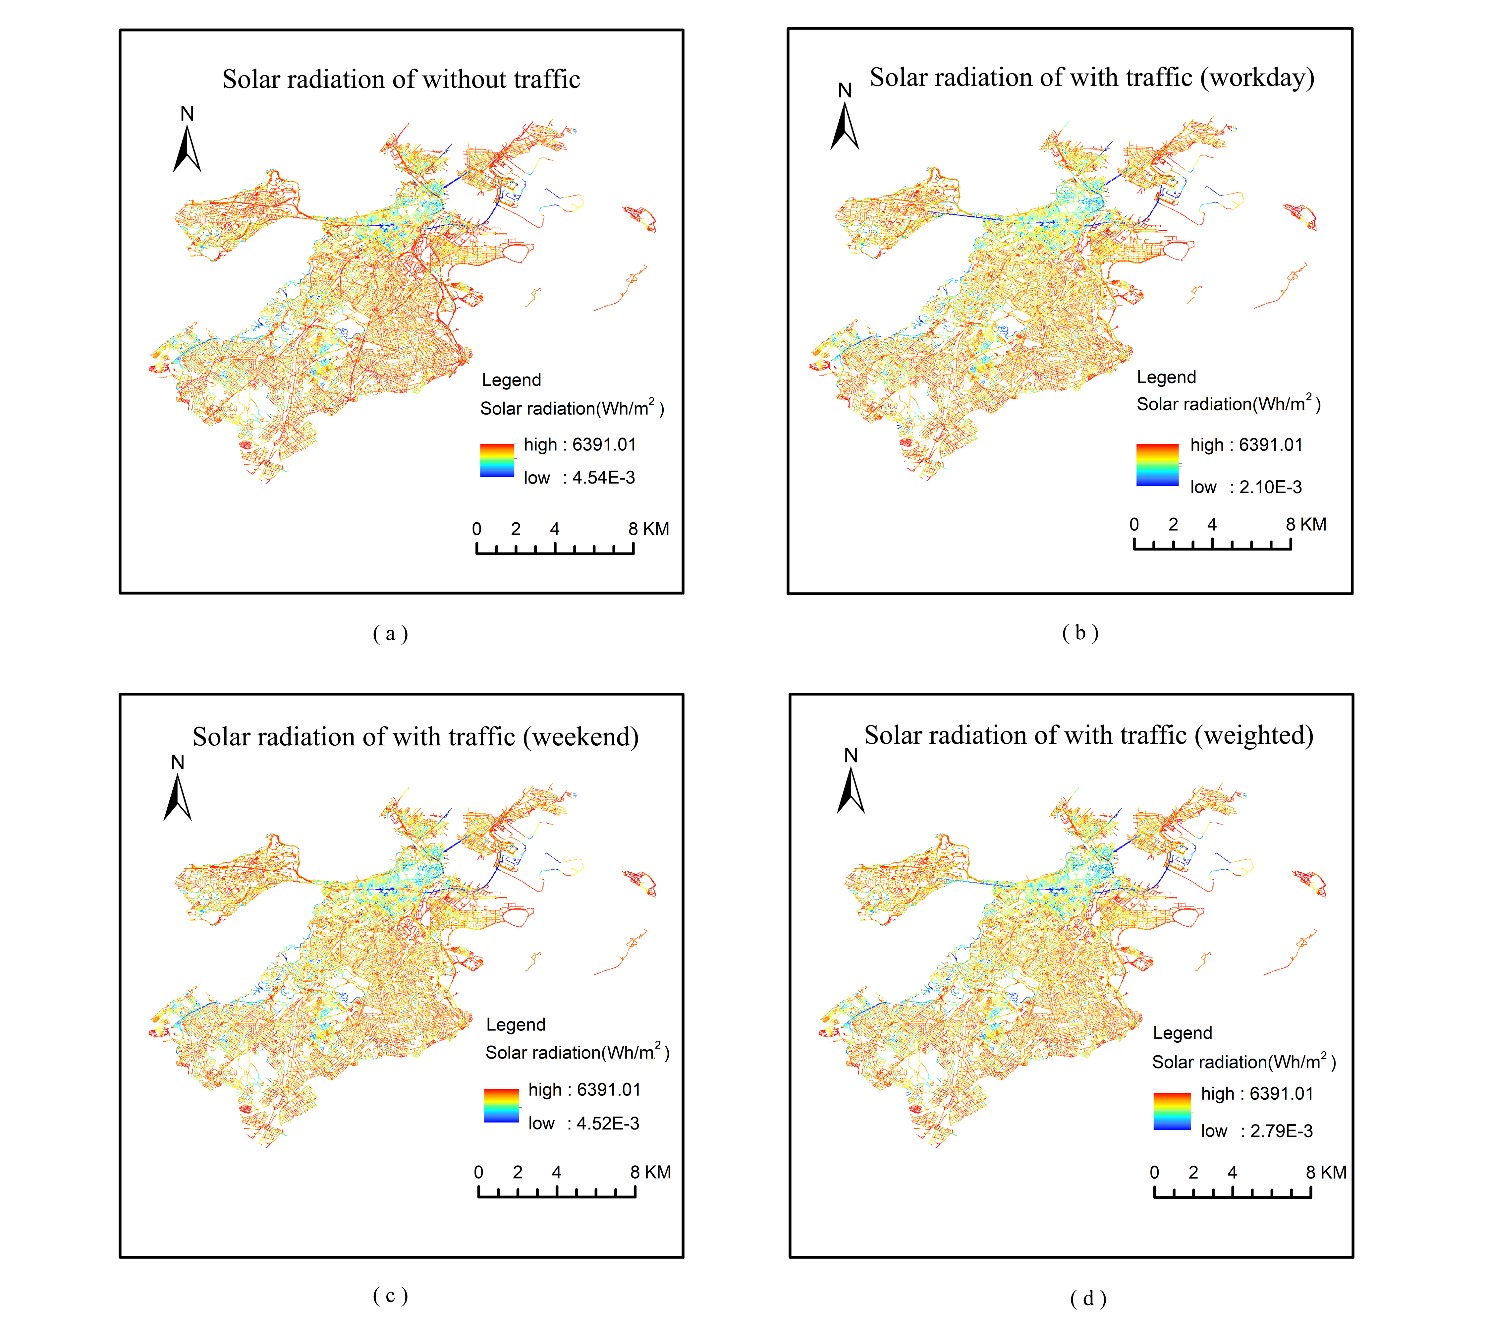
This paper proposes a methodology framework to calculate the solar energy that can be collected by solar panels paved on the road. Estimation of how much energy can be collected help making decision of where these photovoltaic road system should be built. Exemplified by the city of Boston, using street view images and taking light obstacles, traffic conditions, weather conditions and seasonal changes of solar radiation into consideration, the potential of solar energy generated by Boston’s road network is estimated precisely. Our results show that the energy obtained from urban road network can support all private cars in Boston.
Here is the abstract: A sustainable city relies on renewable energy, which promotes the development of electric vehicles. To support electric vehicles, the concept of charging vehicles while driving has been put forward. Under such circumstances, constructing solar panels on urban roads is an innovative option with great benefits, and the accurate calculation of road photovoltaic power generation is a prerequisite. In this paper, we propose a novel framework for predicting and calculating the solar radiation and electric energy that can be collected from the roads. Google Street View images are collected to measure the sky obstruction of roads which is integrated with the solar radiation model to estimate the irradiation receiving capability. In addition to sky obstruction, we also take the impact of traffic conditions and weather situations into consideration in the calculation. Radiation maps at different times in a year are produced from our work to analyze the roads photovoltaic distribution. In order to test the feasibility of our framework, we take Boston as a case study. Results show that roads in Boston can generate abundant electricity for all future electric vehicles in the city. What’s more, main roads through Boston exhibit better power generation potential, and the effect of the traffic condition is limited. Our calculation framework confirms that utilizing solar panels as road surfaces is a great supplement of city power with the unique ability to charge moving cars.
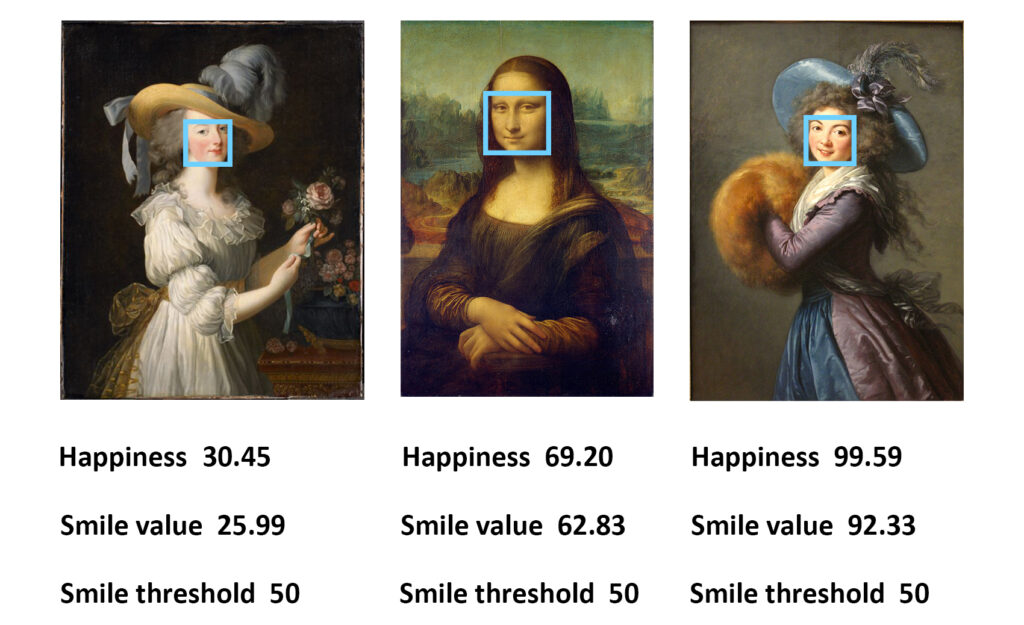
This paper proposes a methodology framework to measure human emotions at places with advanced artificial intelligence technologies and explore the relationship between human emotions and environmental factors. And a ranking list of tourist attractions around the world is created based on human happiness measured using over 2 million facial expressions.
Human happiness scores at world tourist attractions.
Related to this work, Yuhao Kang won the first place in the 2019 AAG Robert Raskin Student best paper competition. Link: http://gis.cas.sc.edu/cisg/?page_id=126
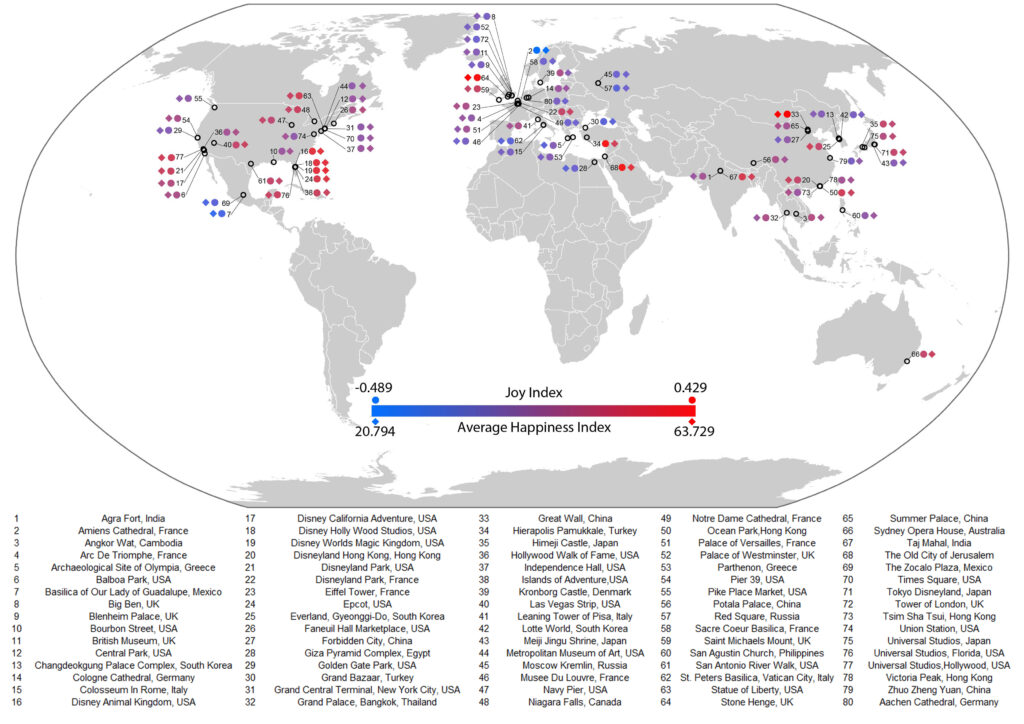
Here is the abstract: The emergence of big data enables us to evaluate the various human emotions at places from a statistic perspective by applying affective computing. In this study, a novel framework for extracting human emotions from large-scale georeferenced photos at different places is proposed. After the construction of places based on spatial clustering of user generated footprints collected in social media websites, online cognitive services are utilized to extract human emotions from facial expressions using state-of-the-art computer vision techniques. And two happiness metrics are defined for measuring the human emotions at different places. To validate the feasibility of the framework, we take 80 tourist attractions around the world as an example and a happiness ranking list of places is generated based on human emotions calculated over 2 million faces detected out from over 6 million photos. Different kinds of geographical contexts are taken into consideration to find out the relationship between human emotions and environmental factors. Results show that much of the emotional variation at different places can be explained by a few factors such as openness. The research may offer insights on integrating human emotions to enrich the understanding of sense of place in geography and in place-based GIS.
Tourist attraction ranking based on the average happiness index using facial expressions.
In our research, state-of-the-art computer vision and AI technologies are utilized to collect, store, handle, manipulate and analyze the human emotions and sentiment at different geographic scales. The research explored what and how people express their emotions at different places, and why and how their emotions would be influenced by environmental factors. Several maps are utilized to visualize where people may be happier than at other locations. In traditional research, we may only use questionnaires to investigate the human emotions and socioeconomic factors. But nowadays, it is possible to collect human emotions using large-scale user generated data online, including tweets, emoji, photos, articles, etc.. As we know, human emotions are innate characteristics of human beings, and with computer technology, it is possible to use objective methods to quantify the subjective human emotion. And it is quite important to build a computational workflow to handle large volumes of user generated data and extract emotion from those data efficiently. Here are several examples which we are working on.
In this study, a novel framework for extracting human emotions from large-scale georeferenced photos at different places is proposed. After the construction of places based on spatial clustering of user generated footprints collected in social media websites, online cognitive services are utilized to extract human emotions from facial expressions using state-of-the-art computer vision techniques. And two happiness metrics are defined for measuring the human emotions at different places. To validate the feasibility of the framework, we take 80 tourist attractions around the world as an example and a happiness ranking list of places is generated based on human emotions calculated over 2 million faces detected out from over 6 million photos. Different kinds of geographical contexts are taken into consideration to find out the relationship between human emotions and environmental factors. Results show that much of the emotional variation at different places can be explained by a few factors such as openness. The research may offer insights on integrating human emotions to enrich the understanding of sense of place in geography and in place-based GIS.
The spatial distribution of 80 tourist sites and their associated emotion indices using facial expression.
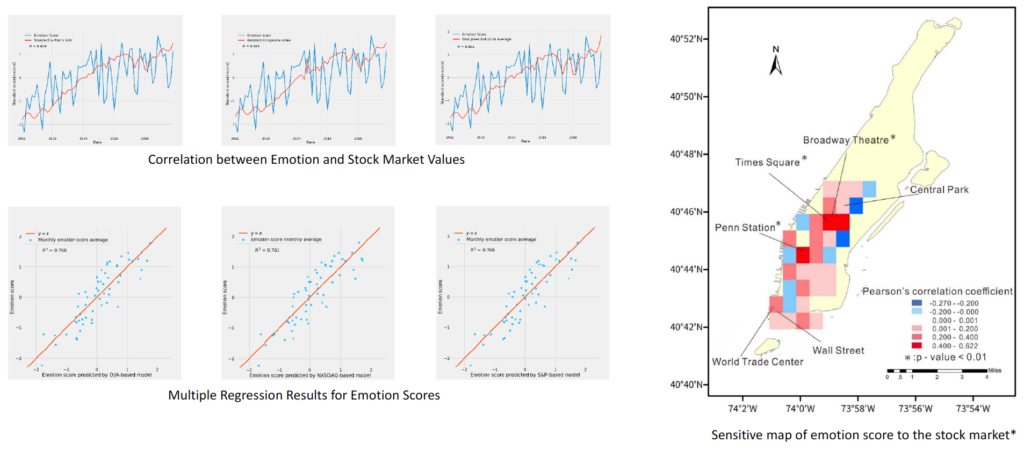
(2) Urban scale: relationship between human emotion and stock market fluctuation at Manhattan
In this research, we examined whether emotion expressed by users in social media can be influenced by stock market index or can predict the fluctuation of the stock market index. We collected the emotion data in Manhattan, New York City using face detection technology and emotion cognition services for photos uploaded to Flickr. Each face’s emotion was described in 8 dimensions the location was also recorded. An emotion score index was defined based on the combination of all 8 dimensions of emotion calculated by principal component analysis. The correlation coefficients between the stock market values and emotion scores are significant (R>0.59 with p < 0.01). Using Granger Causality analysis for cause and effect detection, we found that users’ emotion is influenced by stock market value change. A multiple linear regression model was established (R-square=0.76) to explore the potential factors that influence the emotion score. Finally, a sensitivity map was created to show sensitive areas where human emotion is easily affected by the stock market changes. We concluded that in Manhattan region: (1) there is a statistically significant relationship between human emotion and stock market fluctuation; (2) emotion change follows the movements of the stock market; (3) the Times Square and Broadway Theatre are the most sensitive regions in terms of public emotional reaction to the economy represented by stock value.
(3) Global scale: global human emotions in different groups of people
In this research, we used a huge global scale image dataset: YFCC100, to extract emotions from photos and to describe the worldwide geographic patterns of human happiness. Two indices of Average Smiling Index (ASI) and Happiness Index (HI) are defined from different perspectives to describe the degree of human happiness in a specific region. We computed the spatio-temporal characteristics of facial expression-based happiness on a global scale and linked them to some demographic variables (ethnicity, gender, age, and nationality). After that, the robust analysis was made to ensure our results are reliable. Results are in accordance with some previous studies in Social Science. For example, White and Black are often better at expressing happiness than Asian, women are more expressive than men, and happiness expressed varies across space and time. Our research provides a novel methodology for emotion measurement and it could be utilized for assessing a region‘s emotion conditions based on geo-crowdsourcing data. Robust analysis results indicate that our approaches are reliable and could be implemented for other research projects on place-based human sentiment analysis.