Bin Li, Song Gao, Yunlei Liang, Yuhao Kang, Timothy Prestby, Yuqi Gao, and Runmou Xiao. (2020) “Estimation of Regional Economic Development Indicator from Transportation Network Analytics.” Scientific Reports, 10(2647), 1-15. DOI: https://doi.org/10.1038/s41598-020-59505-2
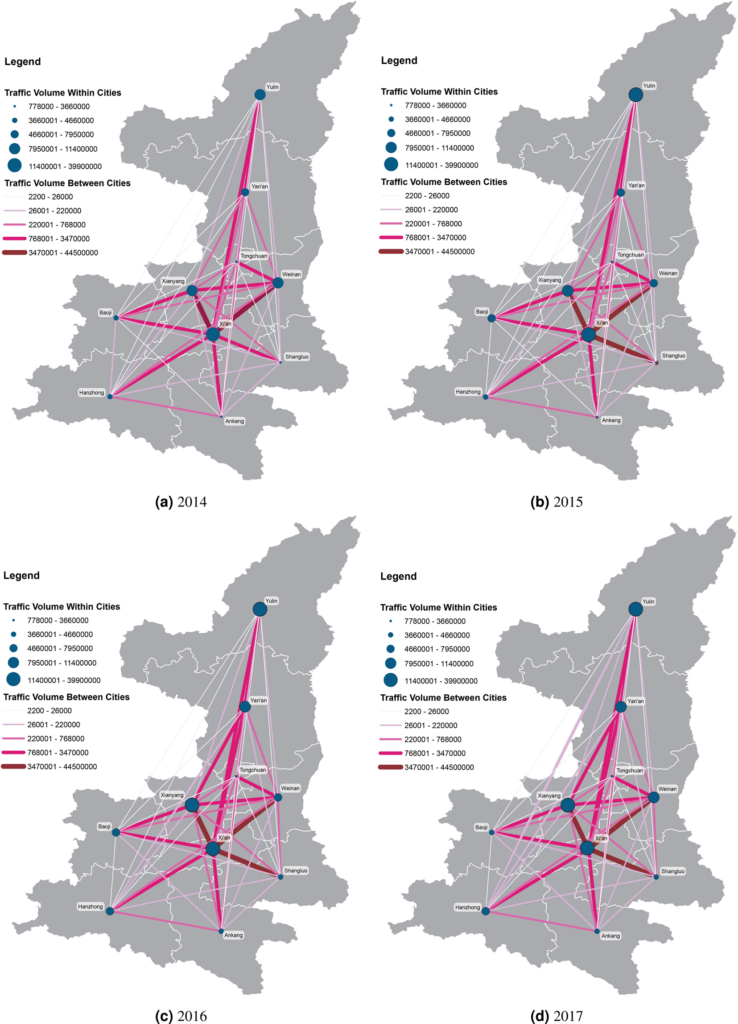
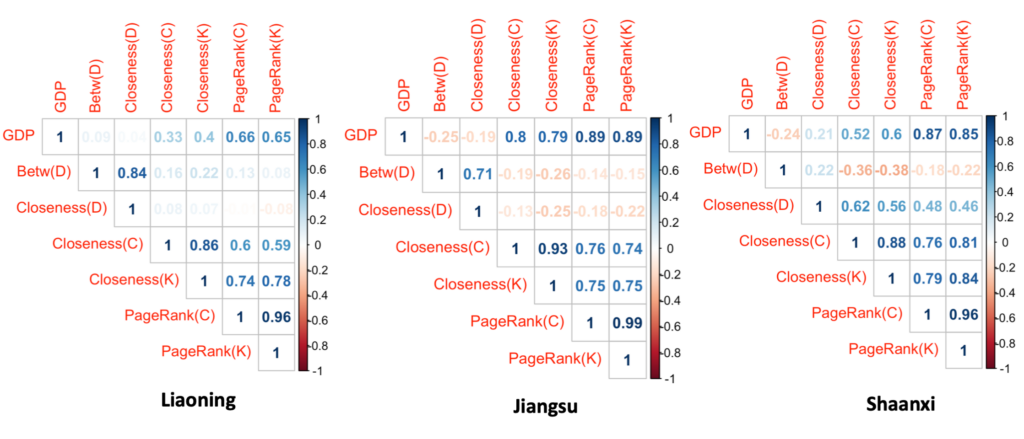
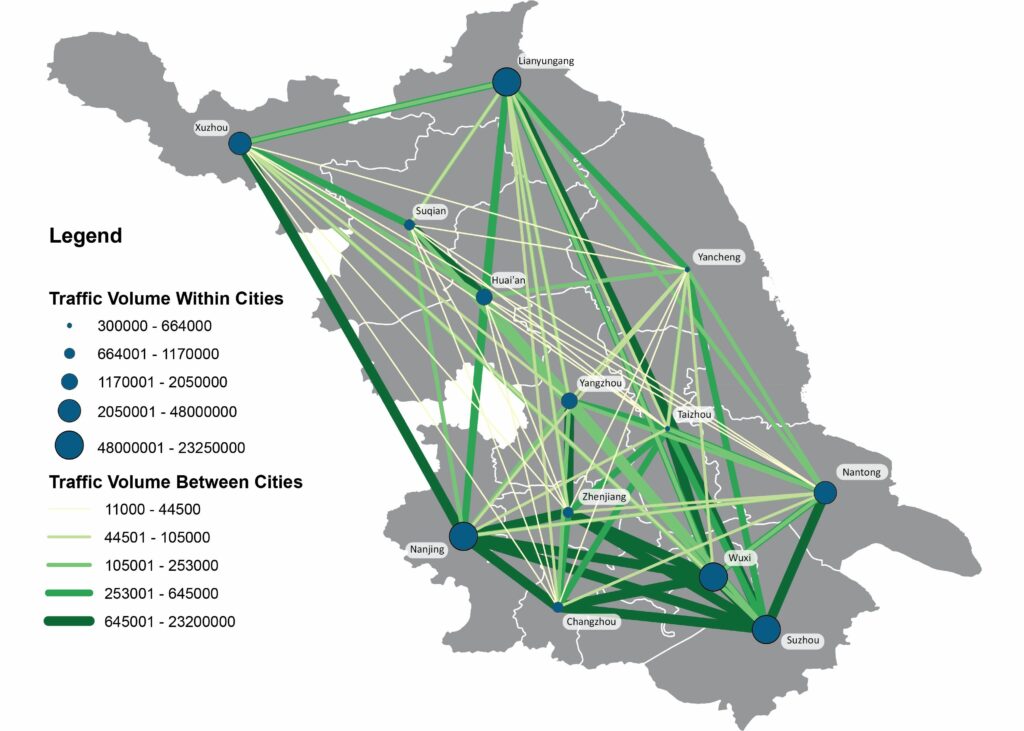
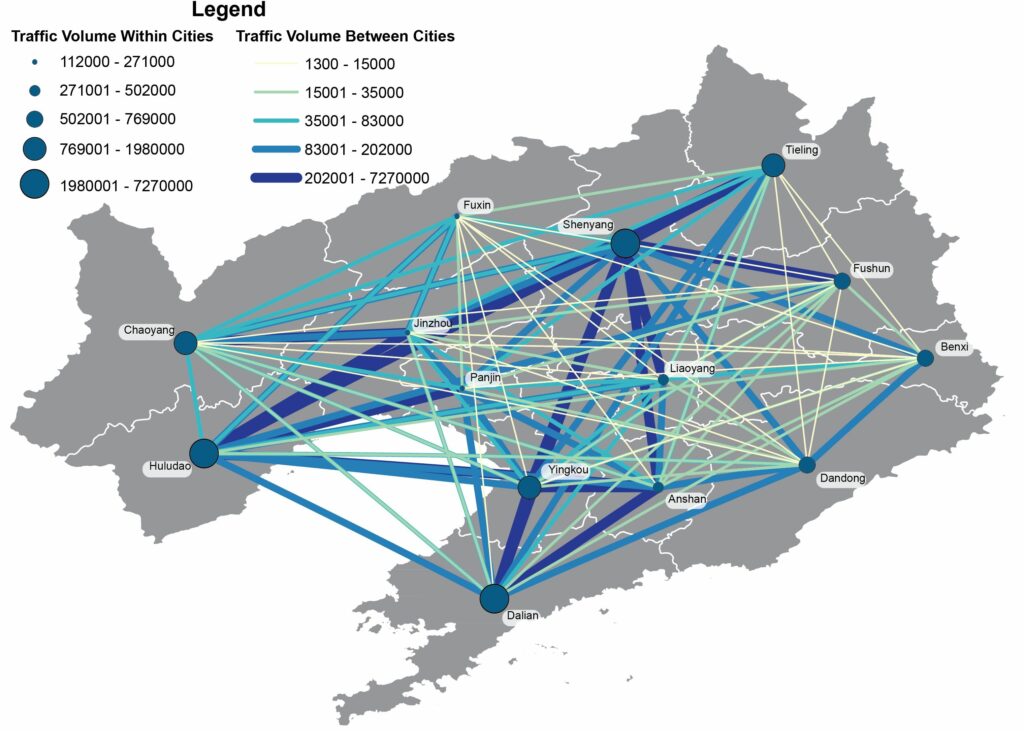
Abstract: With the booming economy in China, many researches have pointed out that the improvement of regional transportation infrastructure among other factors had an important effect on economic growth. Utilizing a large-scale dataset which includes 3.5 billion entry and exit records of vehicles along highways generated from toll collection systems, we attempt to establish the relevance of mid-distance land transport patterns to regional economic status through transportation network analyses. We apply standard measurements of complex networks to analyze the highway transportation networks. A set of traffic flow features are computed and correlated to the regional economic development indicator. The multi-linear regression models explain about 89% to 96% of the variation of cities’ GDP across three provinces in China. We then fit gravity models using annual traffic volumes of cars, buses, and freight trucks between pairs of cities for each province separately as well as for the whole dataset. We find the temporal changes of distance-decay effects on spatial interactions between cities in transportation networks, which link to the economic development patterns of each province. We conclude that transportation big data reveal the status of regional economic development and contain valuable information of human mobility, production linkages, and logistics for regional management and planning. Our research offers insights into the investigation of regional economic development status using highway transportation big data.


