Abstract: The availability and use of geographic information technologies and data for describing the patterns and processes operating on or near the Earth’s surface have grown substantially during the past fifty years. The number of geographic information systems software packages and algorithms has also grown quickly during this period, fueled by rapid advances in computing and the explosive growth in the availability of digital data describing specific phenomena. Geographic information scientists therefore increasingly find themselves choosing between multiple software suites and algorithms to execute specific analysis, modeling, and visualization tasks in environmental applications today. This is a major challenge because it is often difficult to assess the efficacy of the candidate software platforms and algorithms when used in specific applications and study areas, which often generate different results. The subtleties and issues that characterize the field of geomorphometry are used here to document the need for (1) theoretically based software and algorithms; (2) new methods for the collection of provenance information about the data and code along with application context knowledge; and (3) new protocols for distributing this information and knowledge along with the data and code. This article discusses the progress and enduring challenges connected with these outcomes.
New Protocols for Distributing the Data and Code of Geospatial Research
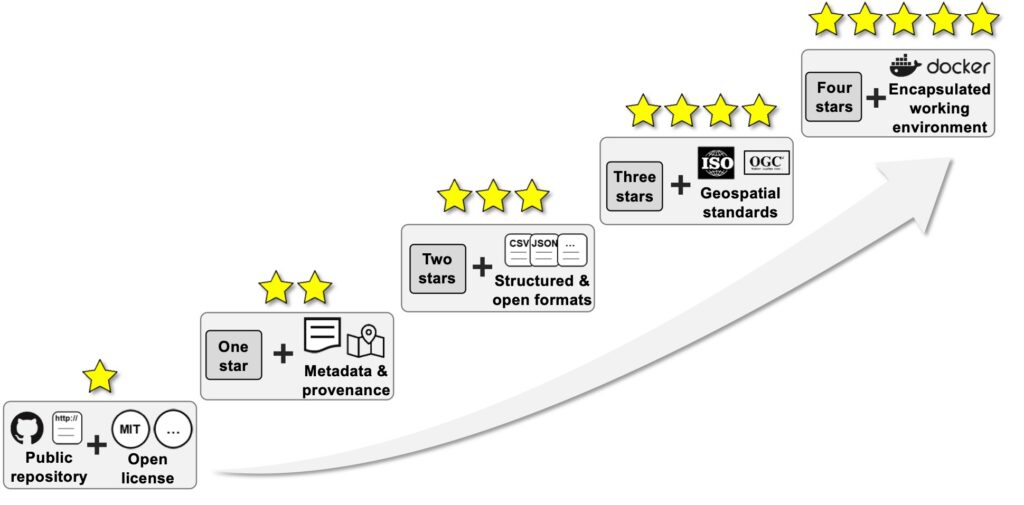
Here, we propose a five-star practical guide for sharing data and code in geospatial research, modeled after the five-star system offered by Berners-Lee (2009) for publishing linked open data on the Web. Instead of asking researchers to share all pieces of data and code, this five-star guide encourages a simple start of data and code sharing, and researchers can move to a higher level when time and other resources allow.
There has not been a time in the history of GIScience when movement analytics and mobility insights have played such an important role in policymaking as in today’s global responses to the COVID-19 crisis. This special section further builds on previous efforts by the editorial team and others from the GIScience community and beyond to advance the body of knowledge in Computational Movement Analysis (CMA). CMA generally refers to series methods and analytical approaches to process, structure, visualize and analyze tracking data and movement patterns to facilitate knowledge discovery and modeling of movement. Specifically, this special section was proposed as part of a pre-conference workshop on Analysis of Movement Data (AMD 2018) at the GIScience 2018 meeting, 28 August 2018, Melbourne, Australia. The focus of this special section is on three aspects of CMA: (1) representation and modeling of movement; (2) urban mobility analytics; and (3) movement analytics using social media data. With the papers presented in the special section, we highlight recent advancements in CMA with the development of methods and techniques for big movement data analytics and utilization of trajectories constructed using user-generated crowdsourced contents such as geo-tagged social media posts. Traditional CMA methods were often developed and evaluated using a smaller set of movement data involving smaller numbers of individuals and contextual variables.
As the momentum to generate more geo-enriched movement data at large volumes, high frequencies and for longer durations continues, this is a timely and significant achievement towards movement data science. As the papers of this special section illustrate, movement data science leverages the advancements in big data analytics, cyberinfrastructure, parallel computing and data fusion to enhance the analysis of large, multi-faceted and multi-sourced movement data. Below are the editorial and the six original papers presented in this special section on the International Journal of Geographical Information Science (IJGIS).
Moving forward, we see a clear need for more reproducible research in CMA, following a growing mega-trend in data-driven sciences. Data quality and privacy challenges as well as uncertainty in data, analytics, and modeling have been largely overlooked in the CMA literature so far. For a more responsible movement data science, careful considerations should be given to the quality, uncertainty and representativeness of ‘large’ mobility data that are being used for generating important mobility insights for policymaking. Lastly, with the recent exciting developments in data access, as a community, we should think about leveraging this advantage to make movement data science more relevant to real-world problems for the mitigation of societal and environmental challenges such as disease outbreaks, population mobility, natural hazards and human-wildlife conflicts.
As efforts to mitigate and suppress COVID-19 continue, many decision makers are asking if digital contact tracing—a method for determining contact between an infected individual and others using tracking systems commonly based on mobile devices—can help us safely transition from population-wide social distancing to targeted case-based interventions such as individualized self-quarantine. In response, the Spatial Analysis Research Center (SPARC) at Arizona State University organized a panel of national experts to discuss the use of geospatial technologies in digital contact tracing and identify the practical challenges researchers can address to make digital contact tracing as effective as possible.
The major themes of the discussion included (i) the capabilities and limitations of geospatial technology, (ii) privacy, and (iii) future research directions. Key takeaways from each of these areas include:
Capabilities and limitations of geospatial technology: There are many geospatial technologies (e.g., GPS, Bluetooth, Cellular, WiFi) embedded in mobile devices that can be leveraged for digital contact tracing. However, GPS technology in smartphones lacks accuracy to map interactions in the detailed way one might expect. For instance, the horizontal accuracy of GPS is 15m, and the vertical accuracy is insufficient to pick up which floor of a building a person is on. Indoor accuracy is particularly poor, which is problematic given people spend 87% of their time indoors. However, information about the absolute location of an individual may not be as important to digitally tracing epidemiologically meaningful contacts as identifying the types of interactions most likely to result in the spread of the virus. The importance of tracing interactions creates an opportunity to use Bluetooth-based exchange of encrypted keys to record person-to-person contacts that can then be analyzed within the space-time prism framework. This approach will not require storing of all individuals’ movement data, which will reduce computation complexity. Geotargeted and geotagged social media are useful for tracking transmission between cities or within cities, detecting large gatherings, and helping individuals recall location and contact history during contact tracing interviews. Social media can also provide useful context, such as check-in locations and textual content, to reduce false positives in interactions identified through other forms of digital contact tracing.
Privacy: Digital contact tracing raises numerous privacy concerns. By creating some record of the location history or contacts of an individual, digital contact tracing creates an opportunity to identify an individual without their consent. At present, the privacy implications of digital contact tracing are unclear because these systems have yet to be fully developed or deployed in the US. An evaluation of pros and cons in the existing digital contact tracing plans operating in other countries can inform policy makers on privacy mediation during and after contact tracing. While companies and officials working on this issue have made statements that preserving privacy is an important goal, the details of how privacy will be preserved and the safeguards that will be put in place are not yet available. If any privacy protections are lifted to enable contact tracing, a plan should be put in place to restore protections once the pandemic subsides.
Future Research: To support digital contact tracing and surveillance, several research areas must be advanced. Key technical areas include increasing the accuracy of indoor positioning, developing approaches for reducing false positive of potential exposure (not to be confused with false negatives which are more common in COVID-19 diagnostic test) ensuring a focus on high accuracy in relative positioning, addressing computational complexities, developing group or bubble based approaches to surveillance, and developing a system for the creation and distribution of high resolution risk data and to enable self-determination of the need of quarantine and testing based on possible exposure. Research into how digital contact tracing systems link with existing contact tracing infrastructure and with other digital contact tracing systems also needs to be conducted. The implications of digital contact tracing for society and privacy will emerge along with these systems. Researchers need to study these issues as they emerge to ensure that we have the ability to hold an informed public debate about the effectiveness and costs of digital contact tracing.
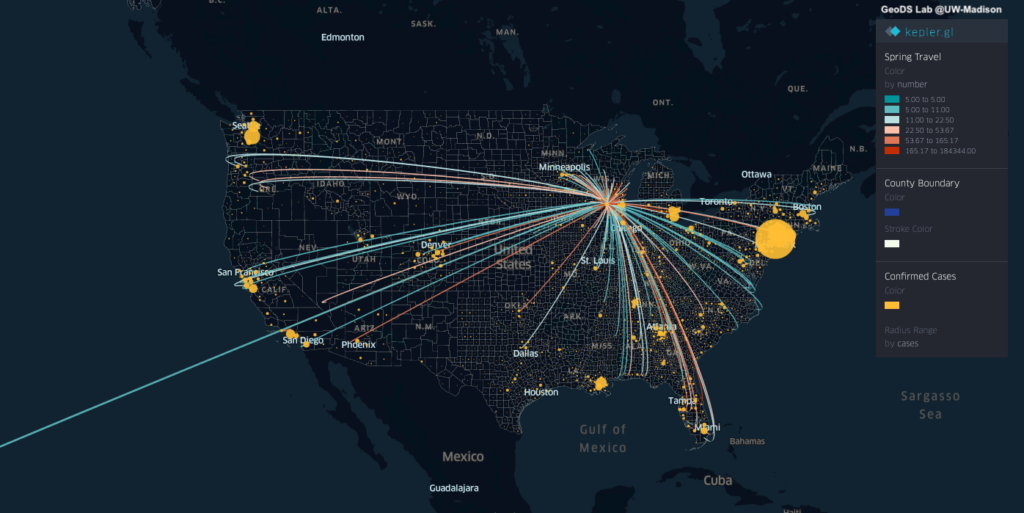
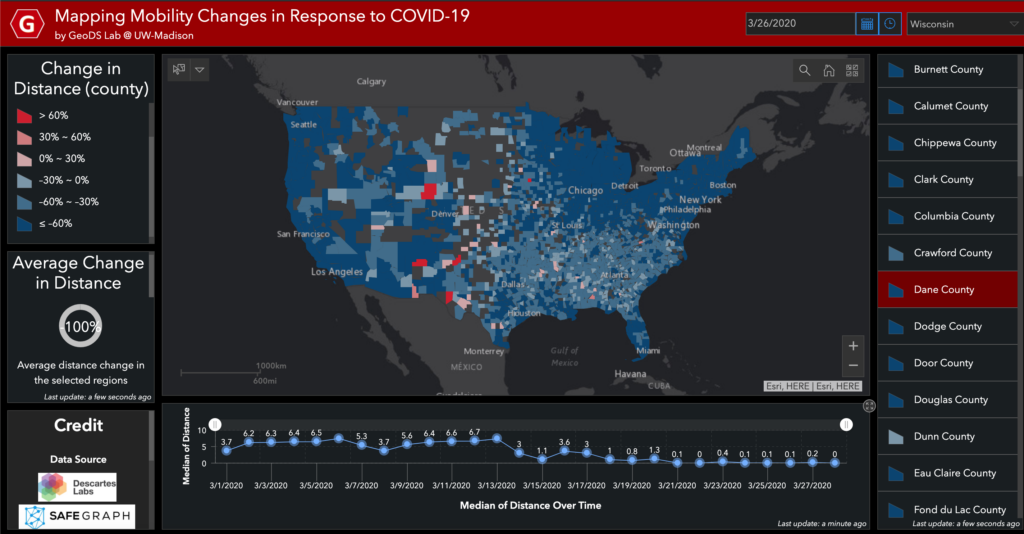
The travels and close contact-tracing from/to infected communities is useful for identifying potential hotspots and assessing the potential risk across different places. A recent research published in Science showed that “substantial undocumented infection facilitates the rapid dissemination of novel coronavirus (SARS-CoV2) “. Understanding the human physical movement patterns and social contacts is a key for saving more lives as one may be surrounded by latent exposed people who don’t show SARS-CoV2 symptoms. Therefore, human mobility patterns and changes could be one indicator for understanding the status of physical social distancing. Here are the neighborhood mobility pattern and the Spring 2019 and March 2020 travel patterns for US cities and counties using the anonymized and aggregated mobile phone location big data in collaboration with SafeGraph, which covers over 3.6 million points of interest (POI) and business venues with visit patterns. Meanwhile, we are working on the whole US 2020 census block data and monitoring new infected areas from the CDC and from a list of Coronavirus dashboards in response to COVID-19.
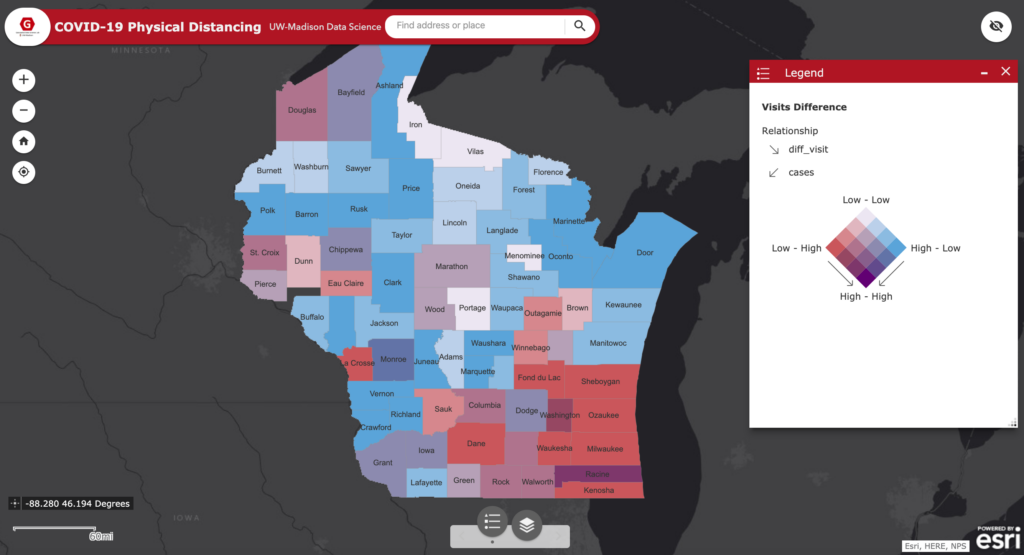
You can find out where people from those POIs / neighborhoods / a county connecting with other neighborhoods and counties across the US. By comparing the POI visits between last March and March 2020, we can summarize the changes and visualize the patterns on the maps to understand whether people in each County/State has reacted to (Physical) Social Distancing.
Interactive Web on COVID-19 Physical Distancing and the relation with the infectious cases in Wisconsin (Using the latest SafeGraph weekly movement patterns in March 2020): https://geods.geography.wisc.edu/covid19/WI/
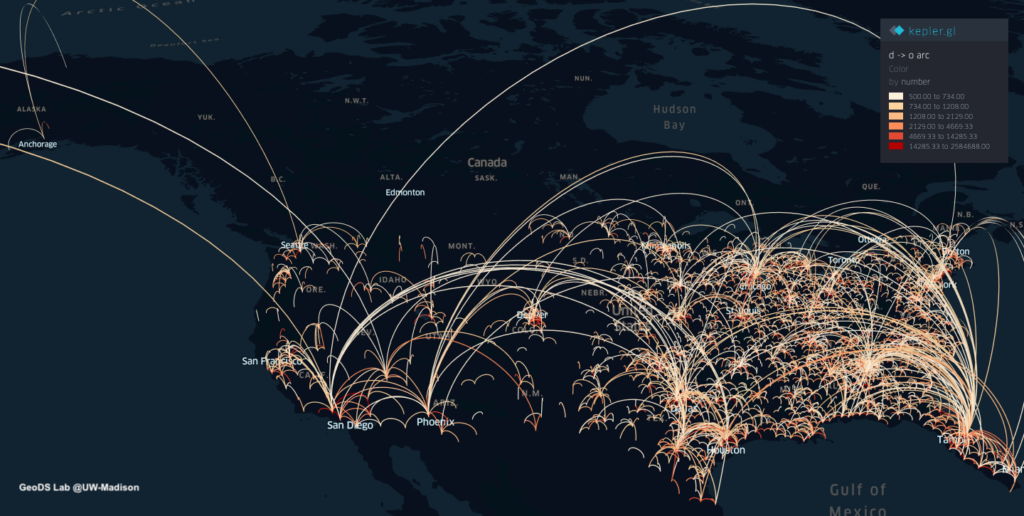
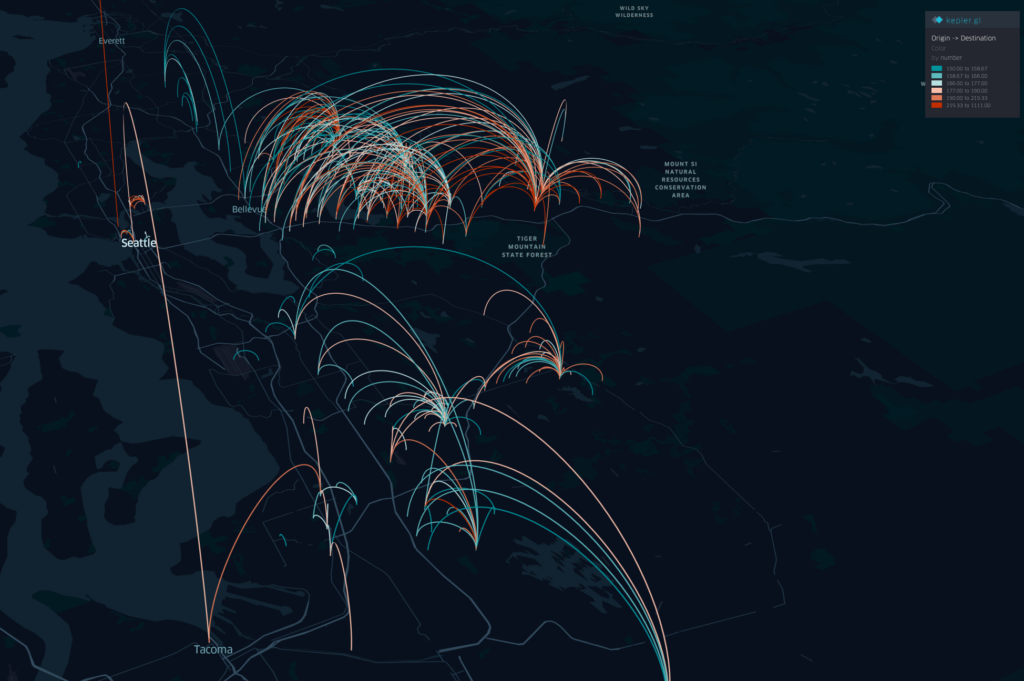
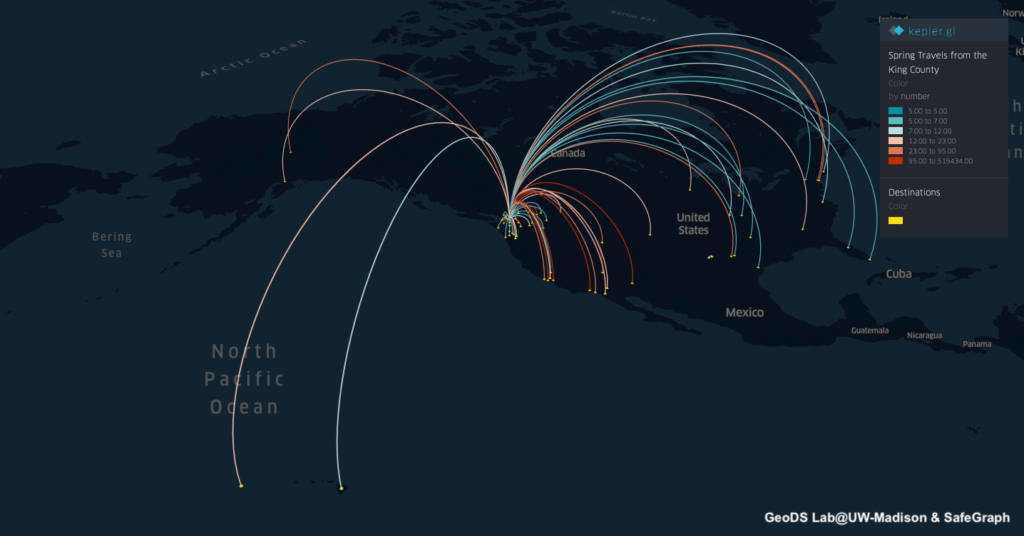
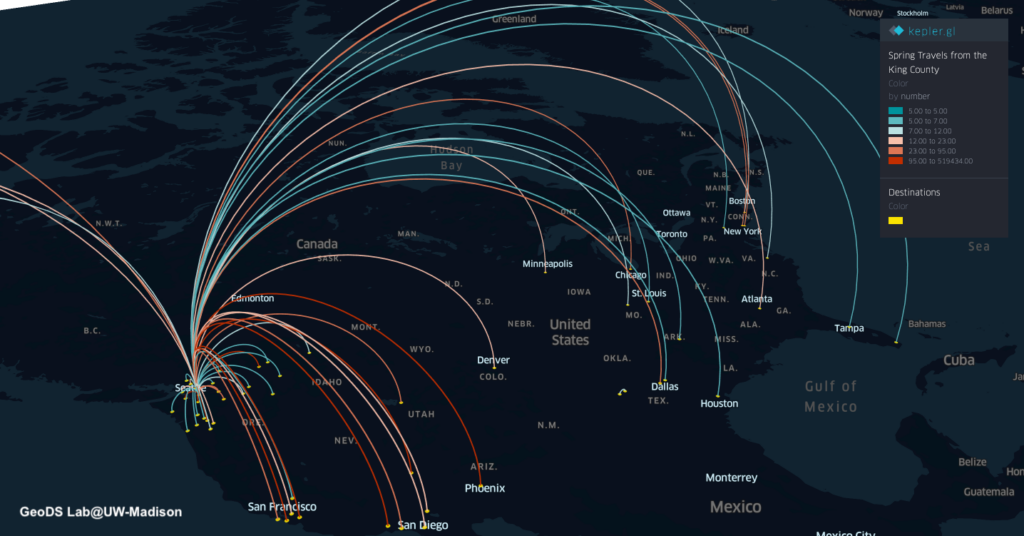
In addition, the maps below show the origin-destination (OD) flows larger than a travel frequency threshold at different spatial scales. The one at the urban scale can help understand the potential spread and hotspots in a city/metropolitan area.
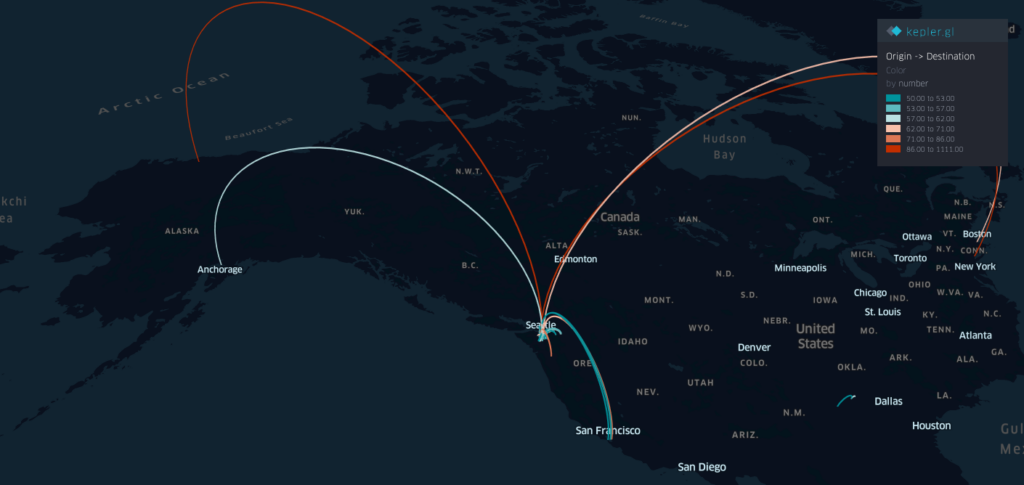
By using the county-level Spring travel data in March, we can see thousands of trips generated from the U.S. counties in the Spring season and widely across the U.S., which may help explain the rapid growth of infection cases across the whole U.S. Our travel-augmented SEIR epidemic modeling results showed that only about 20% of infected cases reported (with testing) at the state level in the US.
Spring travels patterns aggregated at the Country-level in March 2019 from the people who reside in the King County, WASpring travels patterns aggregated at the County-level in March 2019 from the people who reside in the King County, WA(Zoom in to the Pacific Coast Map) Spring travels patterns aggregated at the County-level in March 2019 from the people who reside in the King County, WA
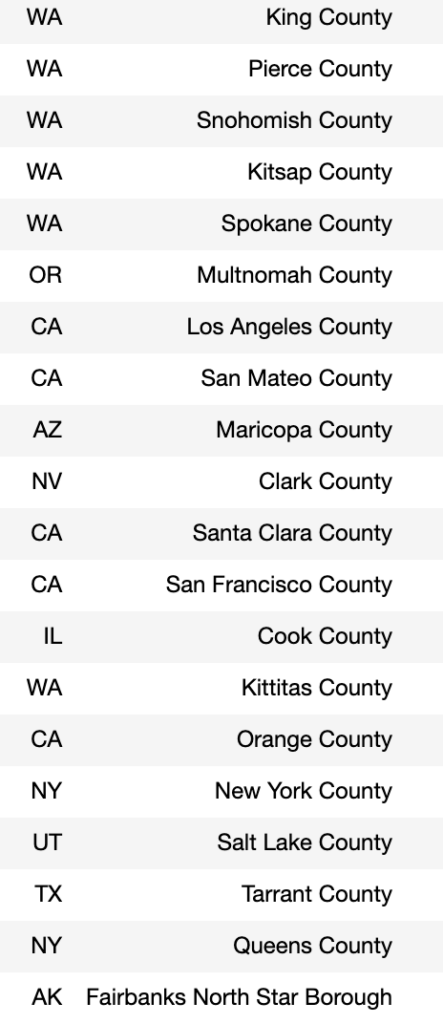
The following table shows the top 20 counties which the people reside in the King County traveled to in March 2019.
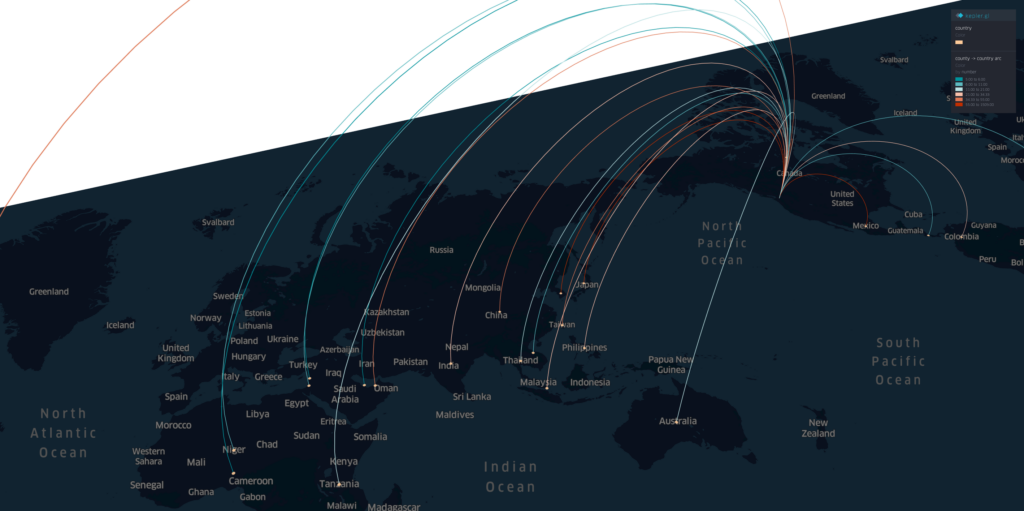
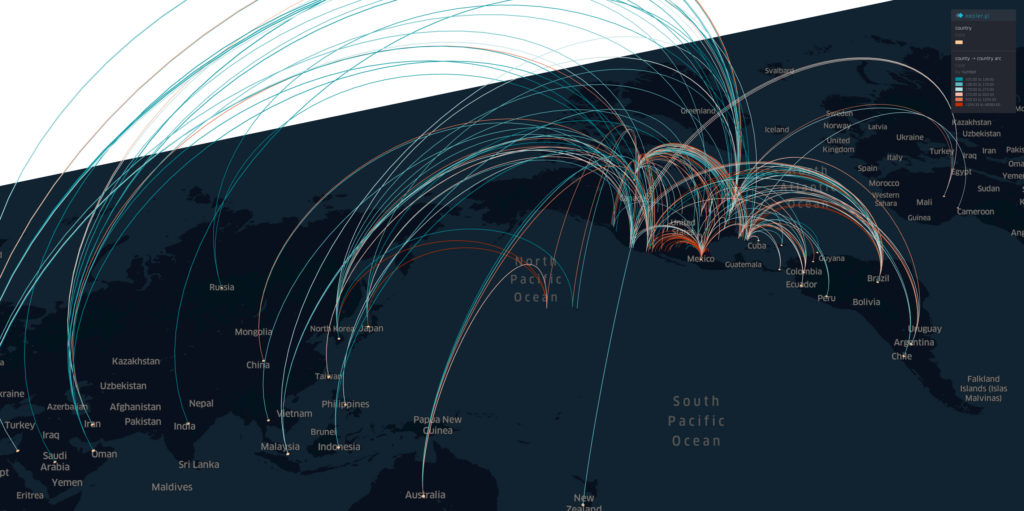
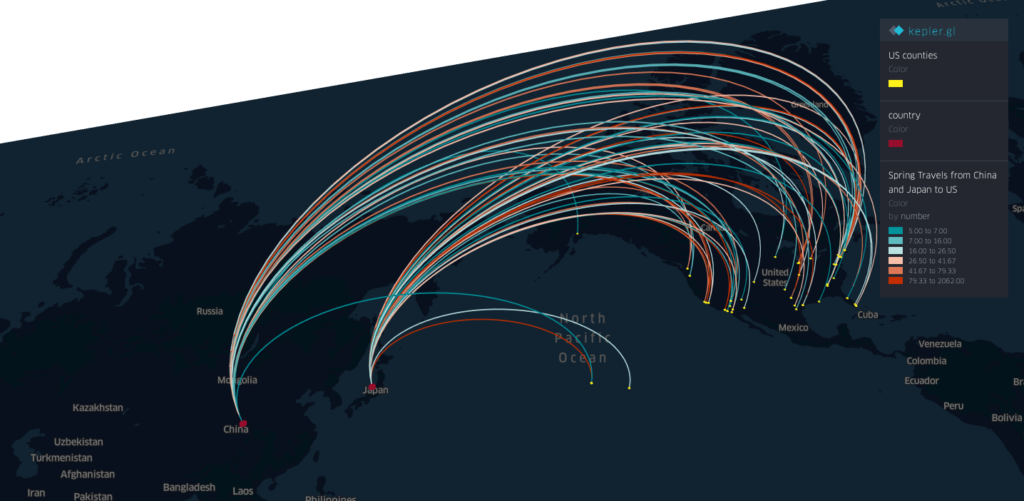
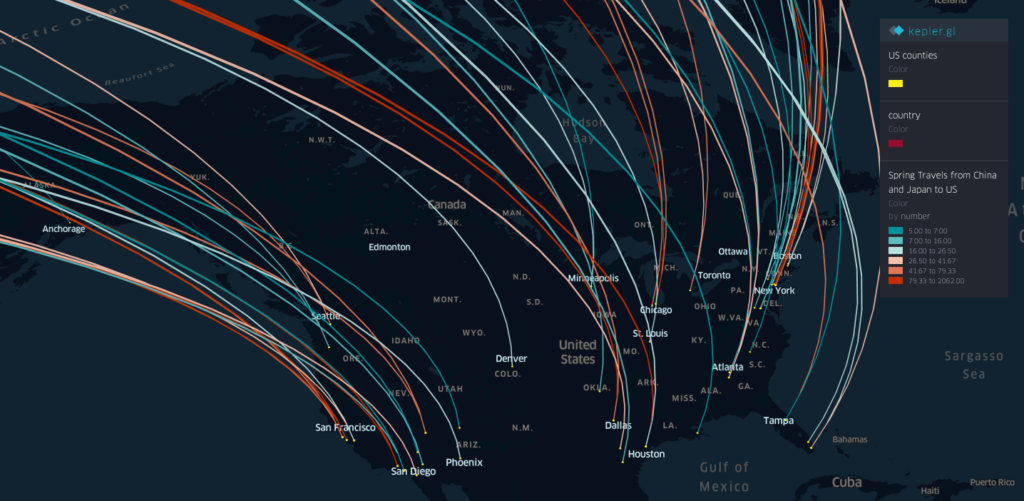
And using the Country-to-US Counties flow data from last March, we can assess how the global travels from other countries outside of US will influence the potential coronavirus outbreak and spread in the US.
The spring international travels to US in March 2019. (filtered by at least 100 people)The spring travels from China and Japan in March 2019.
Acknowledgment: We would like to thank all individuals and organizations for collecting and updating the COVID-19 observation data and reports. Dr. Song Gao acknowledges the funding support provided by the National Science Foundation (Award No. 2027375). Any opinions, findings, and conclusions or recommendations expressed in this material are those of the author(s) and do not necessarily reflect the views of the National Science Foundation.
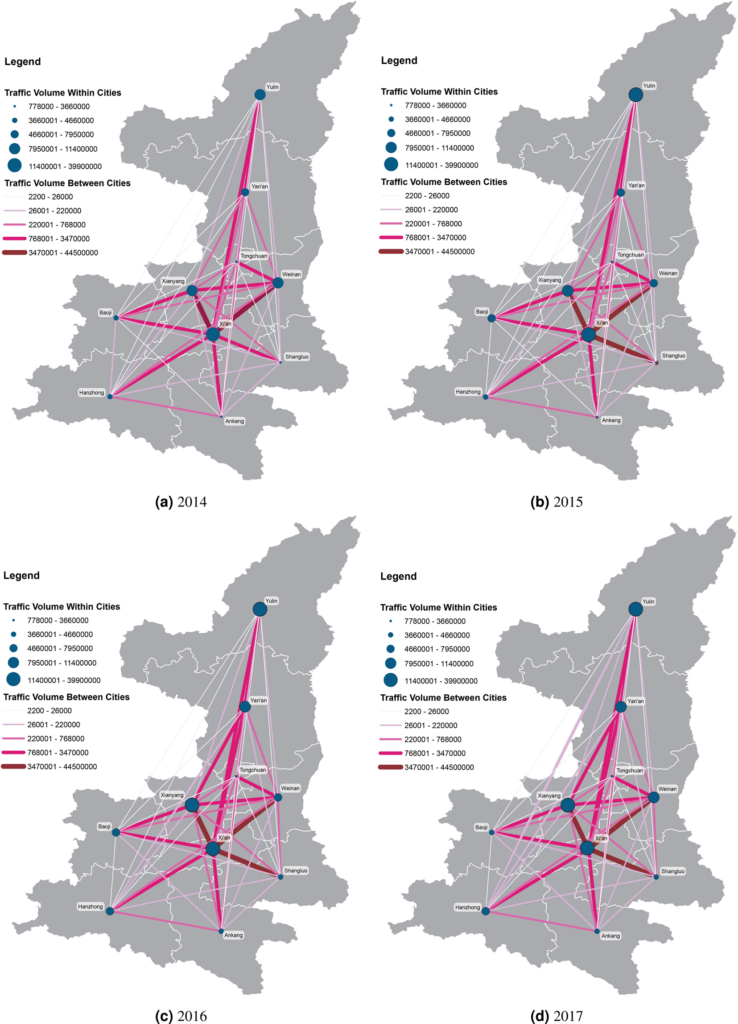
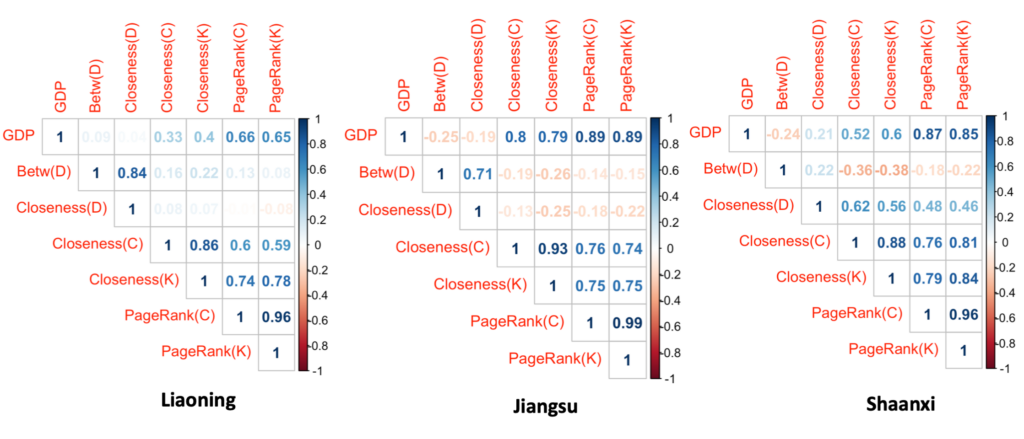
Abstract: With the booming economy in China, many researches have pointed out that the improvement of regional transportation infrastructure among other factors had an important effect on economic growth. Utilizing a large-scale dataset which includes 3.5 billion entry and exit records of vehicles along highways generated from toll collection systems, we attempt to establish the relevance of mid-distance land transport patterns to regional economic status through transportation network analyses. We apply standard measurements of complex networks to analyze the highway transportation networks. A set of traffic flow features are computed and correlated to the regional economic development indicator. The multi-linear regression models explain about 89% to 96% of the variation of cities’ GDP across three provinces in China. We then fit gravity models using annual traffic volumes of cars, buses, and freight trucks between pairs of cities for each province separately as well as for the whole dataset. We find the temporal changes of distance-decay effects on spatial interactions between cities in transportation networks, which link to the economic development patterns of each province. We conclude that transportation big data reveal the status of regional economic development and contain valuable information of human mobility, production linkages, and logistics for regional management and planning. Our research offers insights into the investigation of regional economic development status using highway transportation big data.
Fig. Mapping the annual traffic volumes of cars and buses among cities in Shaanxi province from 2014 to 2017. Fig. The Pearson’s correlation coefficients between city GDP value, betweenness, closeness centrality measures and the PageRank index in transport flow networks of cars & buses (C) and trucks (K) in three provinces. The Betw (D) and Closeness (D) measures are calculated using the spatial interaction networks of cities with the inter-city distances as edge weights.
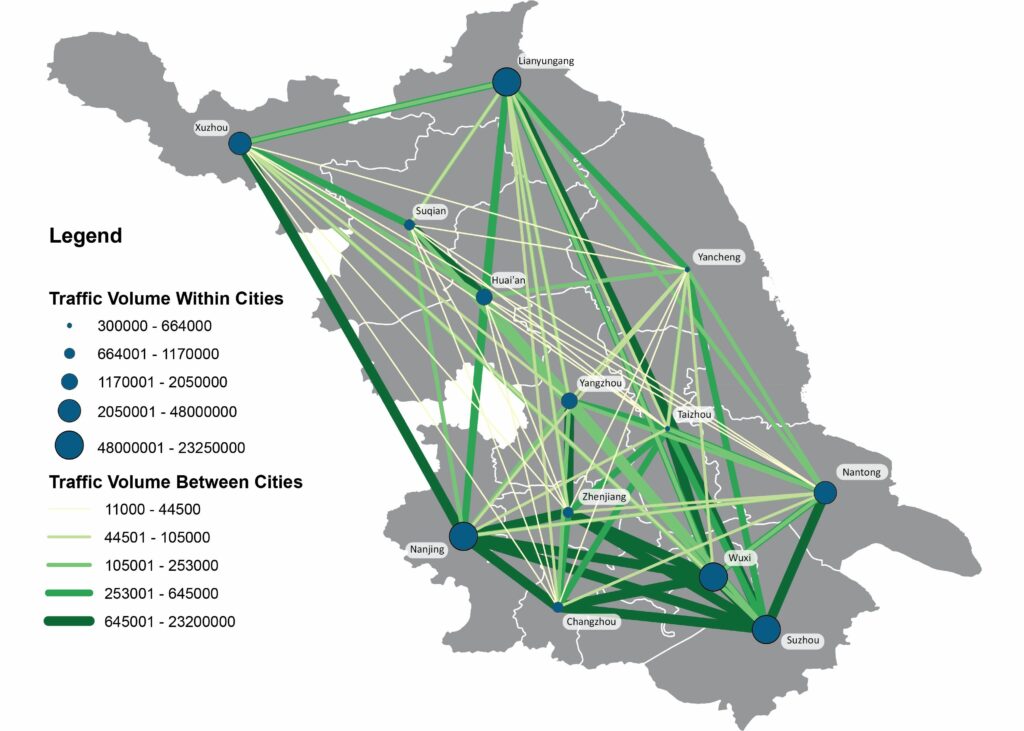
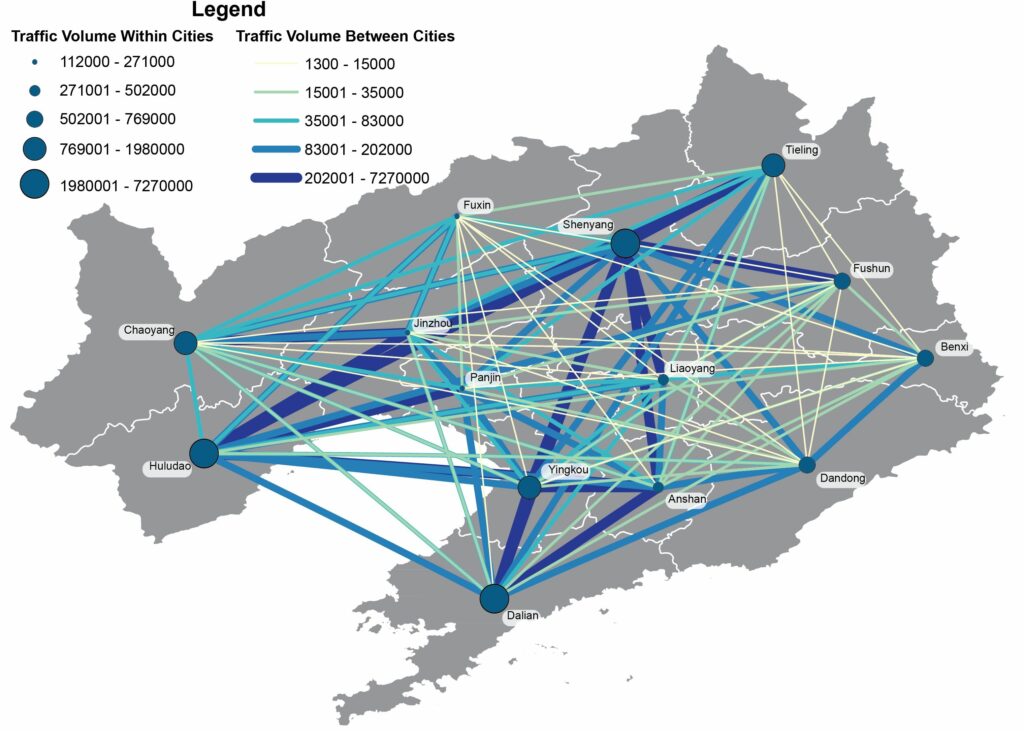
Fig. Mapping the annual traffic volumes of trucks among cities in Jiangsu province in 2017. Fig. Mapping the annual traffic volumes of trucks among cities in Liaoning province in 2017.
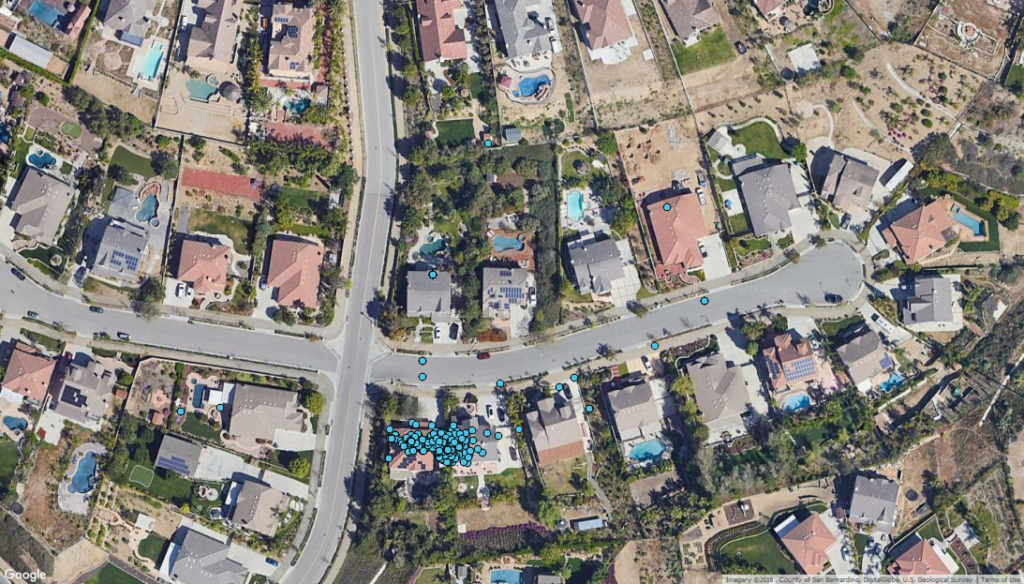
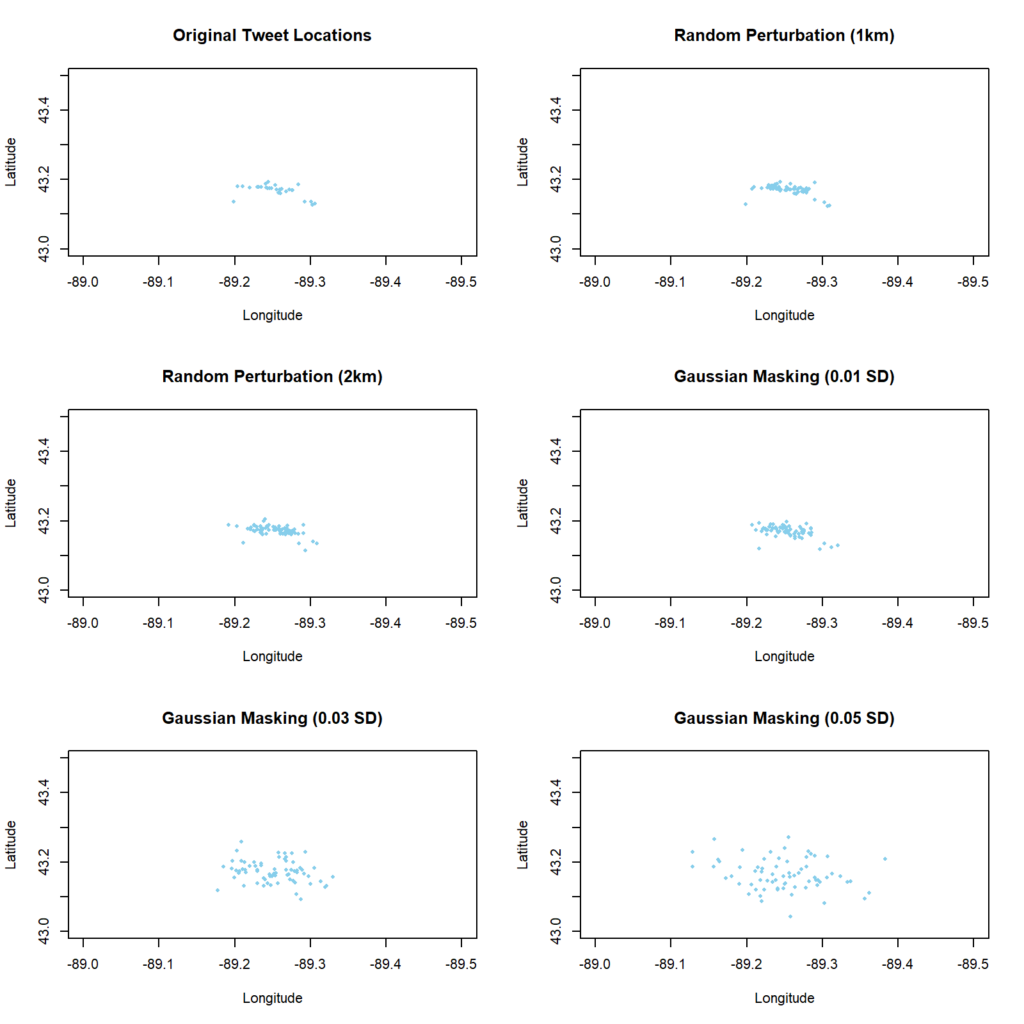
Figure 1: The spatial distribution of geotagged tweets around a Twitter user’s home.
Reference: Song Gao, Jinmeng Rao, Xinyi Liu, Yuhao Kang, Qunying Huang, Joseph App. (2019) Exploring the effectiveness of geomasking techniques for protecting the geoprivacy of Twitter users.Journal of Spatial Information Science. 19, 105-129. DOI: 10.5311/JOSIS.2019.19.510[PDF]
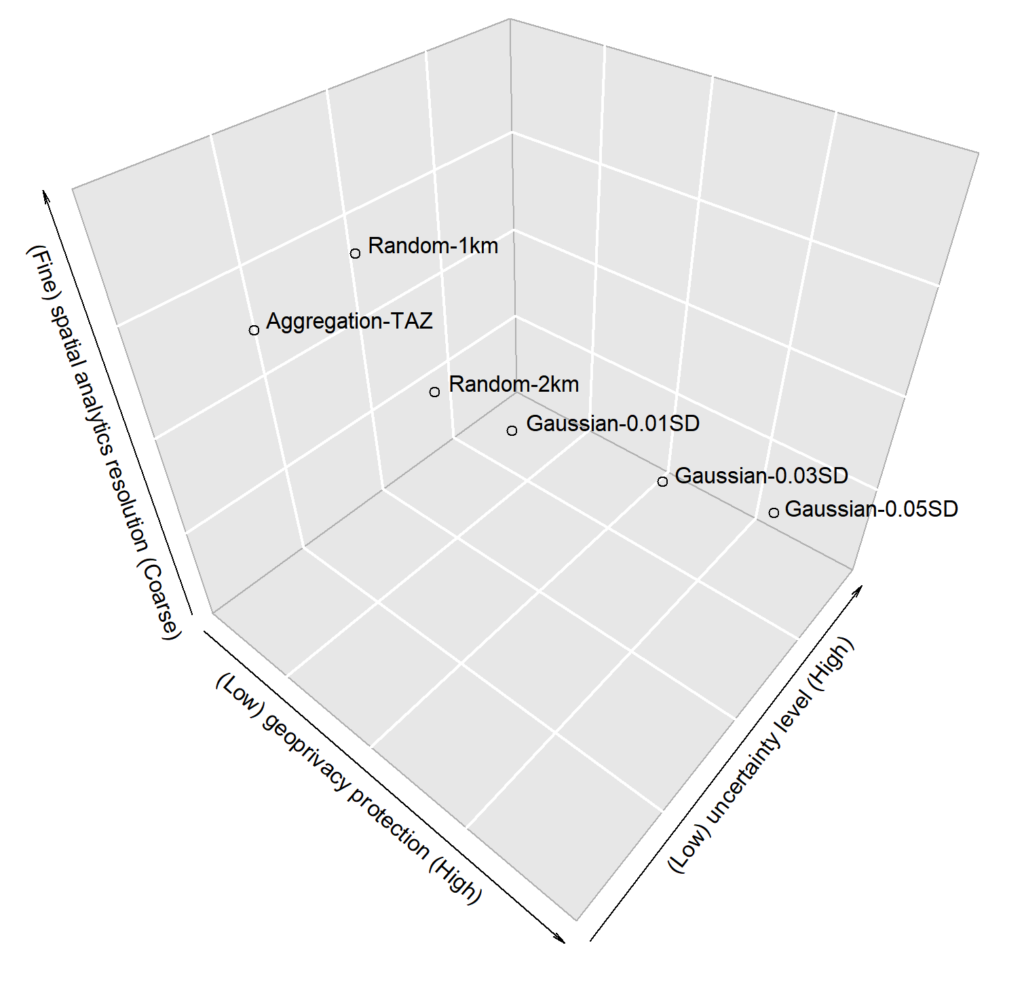
Abstract: With the ubiquitous use of location-based services, large-scale individual-level location data has been widely collected through location-awareness devices. Geoprivacy concerns arise on the issues of user identity de-anonymization and location exposure. In this work, we investigate the effectiveness of geomasking techniques for protecting the geoprivacy of active Twitter users who frequently share geotagged tweets in their home and work locations. By analyzing over 38,000 geotagged tweets of 93 active Twitter users in three U.S. cities (Los Angeles, Madison, and Washington D.C.), the two-dimensional Gaussian masking technique with proper standard deviation settings is found to be more effective to protect user’s location privacy while sacrificing geospatial analytical resolution than the random perturbation masking method and the aggregation on traffic analysis zones. Furthermore, a three-dimensional theoretical framework considering privacy, spatialanalytics, and uncertainty factors simultaneously is proposed to assess geomasking techniques. Our research offers insights into geoprivacy concerns of social media users’ georeferenced data sharing for future development of location-based applications and services.
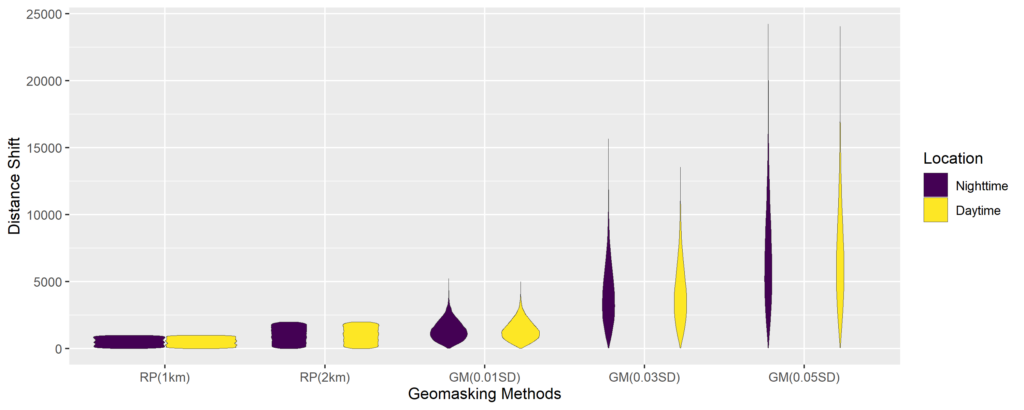
Figure 2: The Gaussian geomasking with different standard deviations (SD) and the random perturbation with 1km and 2km threshold of a user’s geotagged tweets.Figure 10: The violin plot of distance shifts of tweet locations after geomasking.Figure 11: A 3D-cube framework for assessing different geomasking techniques; the position of each method is estimated from the results of our case study.
Broader Impacts: In fact, Twitter removes support for precise geotagging since June, 2019. However, the metadata of historical tweets prior to the policy change may still reveal precise GPS coordinates. In addition, when a user deletes a geotagged tweet , Twitter does not guarantee the information will be completely removed from all copies of the data on third-party applications or in external search results. Even if the precise GPS location is not available anymore, Twitter users are still able to add place tags (e.g., a city, office building, apartment, landmark, and many other types of places) to their geotagged tweets, which can be converted to the GPS coordinates (often using the centroid as a representation location). This is similar to the aforementioned aggregation-based masking approach, thus we may still be able to get users’ sensitive locations based on fine-scale place tags. People should be aware that sharing or publishing such kind of location data involve geoprivacy issues and the geomasking technique provides a way to help mitigate the problem not only for Twitter users but also for other telematics and social media platforms such as Facebook, Flickr, Weibo, and Instagram where geotagging or place-tagging is accessible, as well as for mobile applications that track individual locations.
Geospatial artificial intelligence (GeoAI) is an interdisciplinary field that has received tremendous attention from both academia and industry in recent years. We recently published an article that reviews the series of GeoAI workshops held at the Association for Computing Machinery (ACM) International Conference on Advances in Geographic Information Systems (SIGSPATIAL) since 2017. These workshops have provided researchers a forum to present GeoAI advances covering a wide range of topics, such as geospatial image processing, transportation modeling, public health, and digital humanities. We provide a summary of these topics and the research articles presented at the 2017, 2018, and 2019 GeoAI workshops. We conclude with a list of open research directions for this rapidly advancing field.
1st ACM SIGSPATIAL International Workshop AI and Deep Learning for Geographic Knowledge Discovery (GeoAI’17). Redondo Beach, CA, USA – November 7, 2017. DOI: 10.1145/3178392.3178408[PDF]
2nd ACM SIGSPATIAL International Workshop AI and Deep Learning for Geographic Knowledge Discovery (GeoAI’18). Seattle, WA, USA – November 6, 2018. DOI: 10.1145/3307599.3307609[PDF]
3rd ACM SIGSPATIAL International Workshop AI and Deep Learning for Geographic Knowledge Discovery (GeoAI’19). Chicago, IL, USA – November 5, 2019. DOI: 10.1145/3356471[PDF]
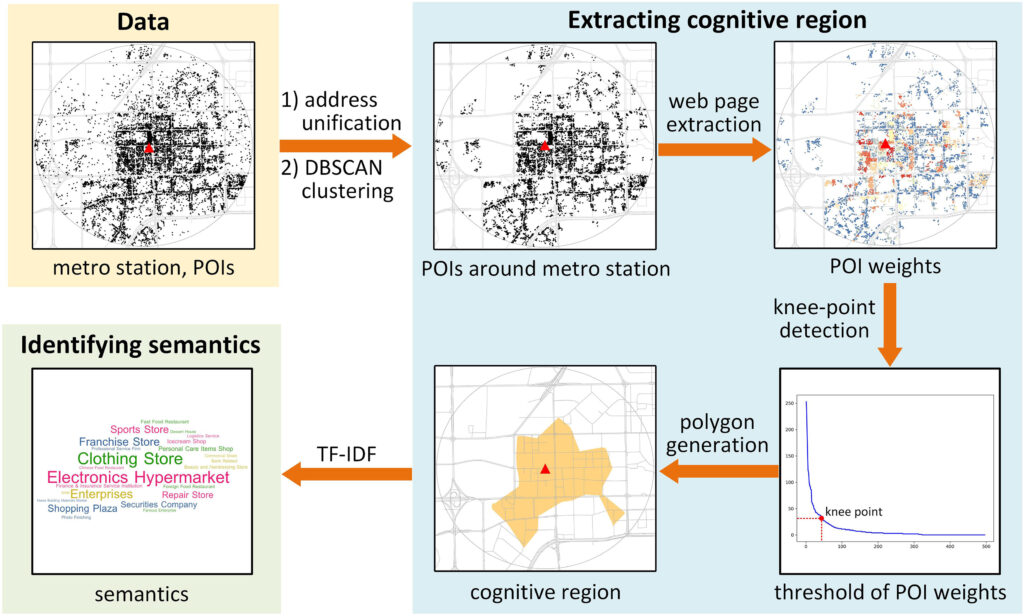
Fig. 1. The proposed framework for extracting and understanding the cognitive regions of urban metro stations.
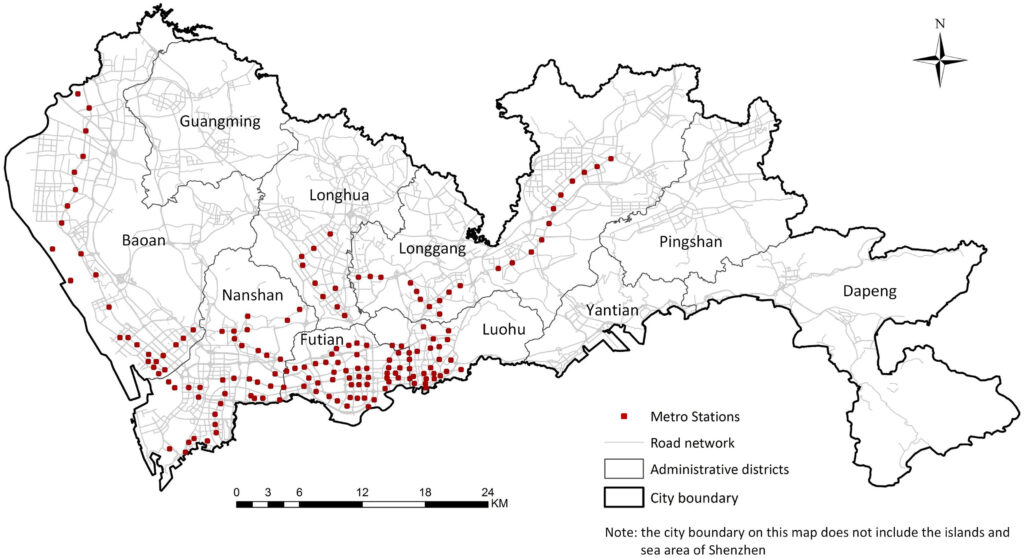
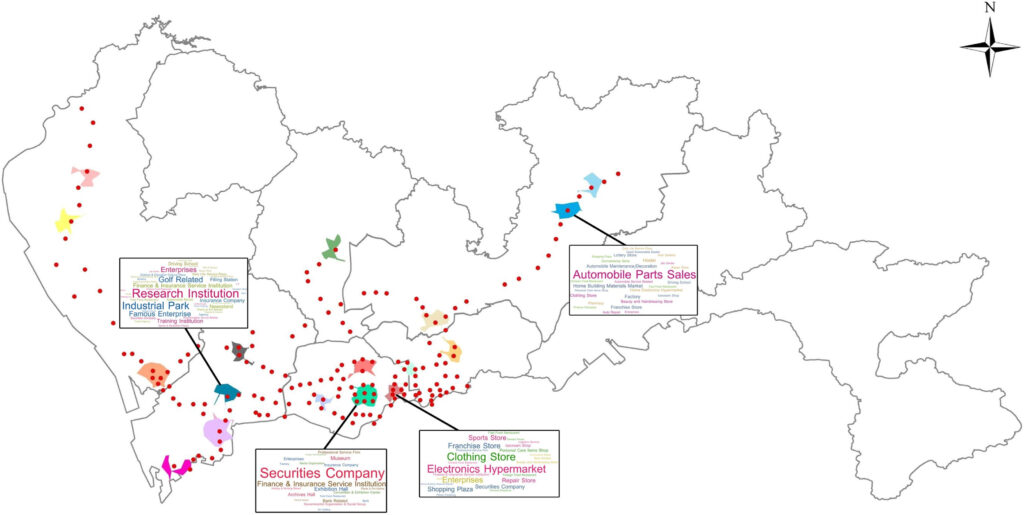
Abstract: The significance of urban metro stations extends beyond their roles as transport nodes in a city. Their surroundings are usually well developed and attract a lot of human activities, which make the metro station areas important cognitive places characterized by vague boundaries and rich semantics. Current studies mainly define metro station areas based on an estimation of walking distance to the stations (e.g., 700 m) and investigate these areas from the perspectives of transportation and land use instead of as cognitive places perceived by the crowd. To fill this gap, this study proposes a novel framework for extracting and understanding the cognitive regions of urban metro stations based on points of interest (POIs). First, we extract the cognitive regions of metro stations based on co-occurrence patterns of the stations and their surrounding POIs on web pages by proposing a cohesive approach combined of spatial clustering, web page extraction, knee-point detection, and polygon generation techniques. Second, we identify the semantics of metro stations based on POI types inside the regions using the term frequency-inverse document frequency (TF-IDF) method. In total 166 metro stations along with more than one million POIs in Shenzhen, China are utilized as data sources of the case study. The results indicate that our proposed framework can well detect the place characteristics of urban metro stations, which enriches the place-based GIS research and provides a human-centric perspective for urban planning and location-based-service (LBS) applications.
Implications for urban planning
As Kevin Lynch stated in The Image of the City (Lynch, 1960), the skeleton of individuals’ mental images is formed by five types of elements in the city: paths, edges, nodes, districts and landmarks, which mediates in the interaction between humans and their environment. The first thing we want to emphasize in this study is that urban metro stations are also one type of such cognitive elements (i.e., landmarks) in cities; their properties as cognitive places should be considered in urban planning and design so as to match people’s cognition. In addition, our extracted cognitive regions of urban metro stations show diverse and irregular shapes, which indicates that unified physical distances frequently used in existing studies and planning practices cannot precisely define TOD precincts perceived by humans. To this end, what we suggest in this study is that urban planning practices should attach importance to “cognitive place” and “cognitive distance”, which load human experiences and perceptions toward the environments (Briggs, 1973; Montello, 1991). This is also coincident with the ultimate goal of urban planning, urban design, and smart-city construction, i.e., making better human societies and improving human lives (Shaw & Sui, 2019).
Abstract: What is the current state-of-the-art in integrating results from artificial intelligence research into geographic information science and the earth sciences more broadly? Does GeoAI research contribute to the broader field of AI, or does it merely apply existing results? What are the historical roots of GeoAI? Are there core topics and maybe even moonshots that jointly drive this emerging community forward? In this editorial, we answer these questions by providing an overview of past and present work, explain how a change in data culture is fueling the rapid growth of GeoAI work, and point to future research directions that may serve as common measures of success.
Moonshot (Editorial): Can we develop an artificial GIS analyst that passes a domain-specific Turing Test by 2030?
Keywords: Spatial Data Science, GeoAI, Machine Learning, Knowledge Graphs, Geo-Semantics, Data Infrastructure
Acknowledgement: we sincerely thank all the reviewers who contribute their time to the peer-review process and ensure the quality of the accepted papers.
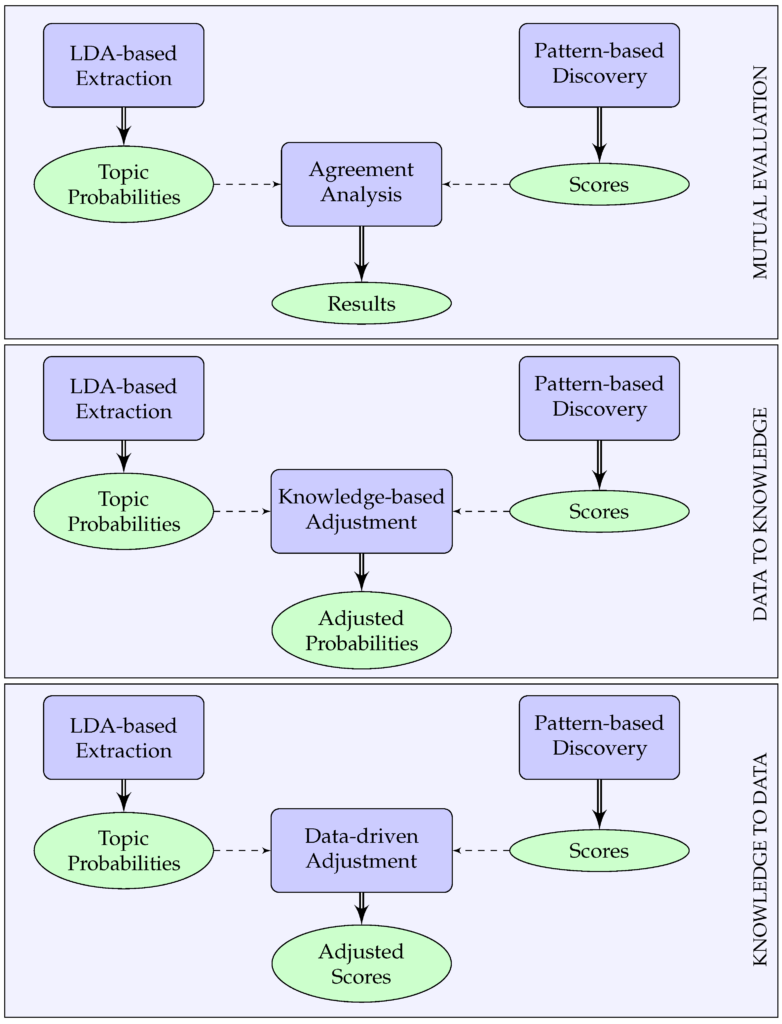
The problem of discovering regions that support particular functionalities in an urban setting has been approached in literature using two general methodologies: top-down, encoding expert knowledge on urban planning and design and discovering regions that conform to that knowledge; and bottom-up, using data to train machine learning models, which can discover similar regions. Both methodologies face limitations, with knowledge-based approaches being criticized for scalability and transferability issues and data-driven approaches for lacking interpretability and depending heavily on data quality.
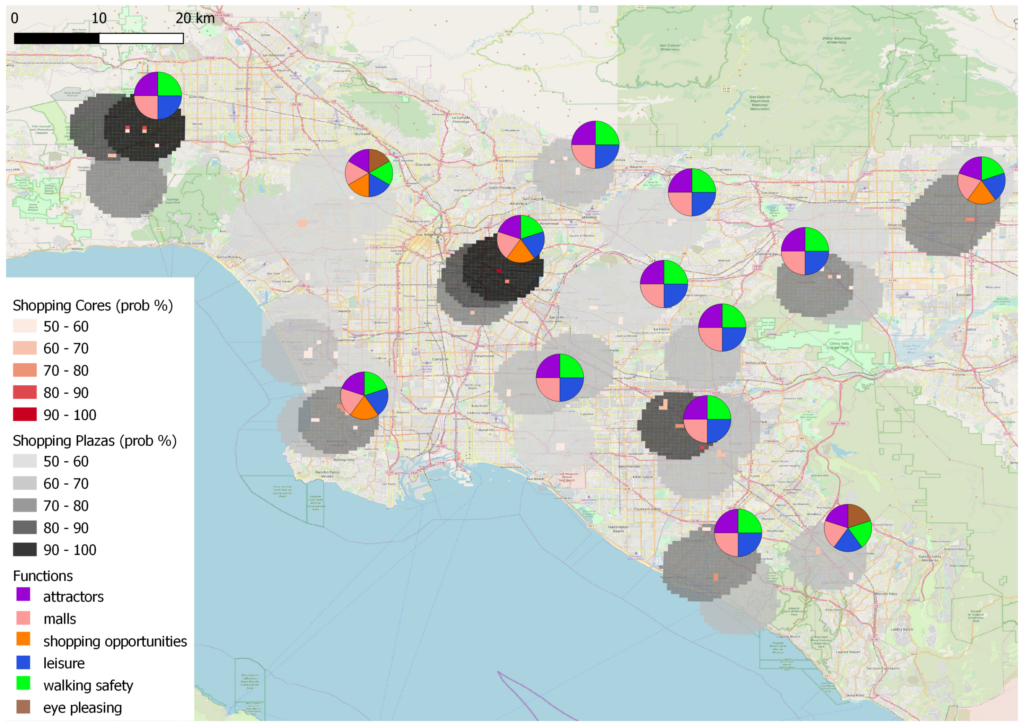
To mitigate these disadvantages, we propose a novel framework that fuses a knowledge-based approach using design patterns and a data-driven approach using latent Dirichlet allocation (LDA) topic modeling in three different ways: Functional regions discovered using either approach are evaluated against each other to identify cases of significant agreement or disagreement; knowledge from patterns is used to adjust topic probabilities in the learning model; and topic probabilities are used to adjust pattern-based results. The proposed methodologies are demonstrated through the use case of identifying shopping-related regions in the Los Angeles metropolitan area. Results show that the combination of pattern-based discovery and topic modeling extraction helps uncover discrepancies between the two approaches and smooth inaccuracies caused by the limitations of each approach.
Figure. The proposed framework of fusing knowledge-based and data-driven approachesFigure. Extracted shopping regions by combining data-to-knowledge and knowledge-to-data approaches.
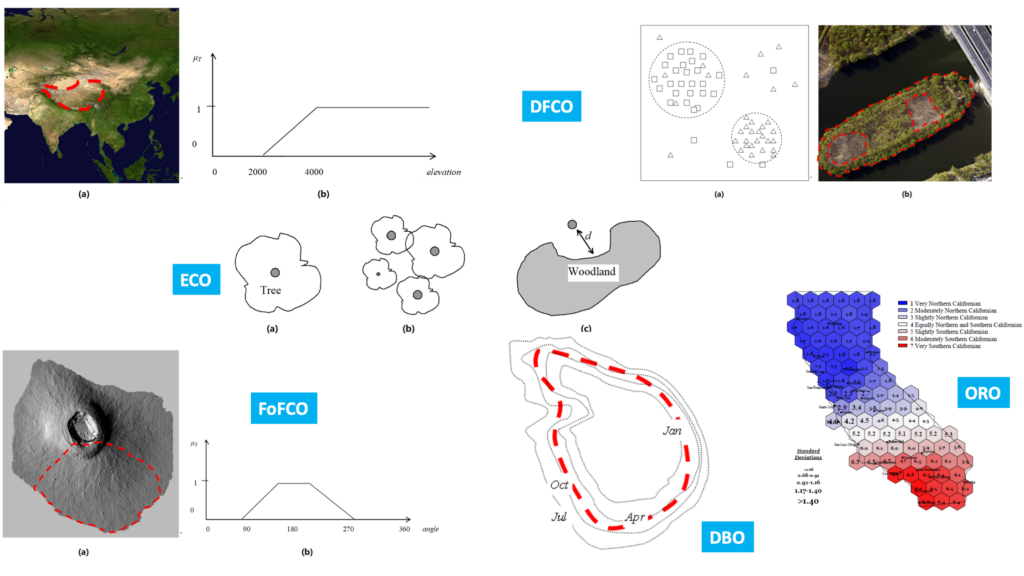
Liu, Y., Yuan, Y., & Gao, S. (2019). Modeling the Vagueness of Areal Geographic Objects: A Categorization System. ISPRS International Journal of Geo-Information, 8(7), 306. DOI: https://doi.org/10.3390/ijgi8070306
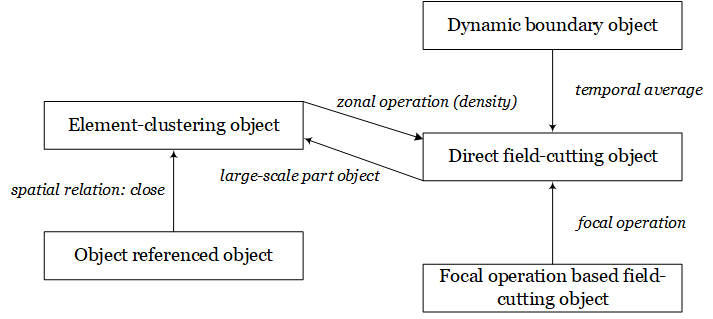
Abstract: Modeling vague objects with indeterminate boundaries has drawn much attention in geographic information science (GIScience). Because fields and objects are two perspectives in modeling geographic phenomena, this paper investigates the characteristics of vague regions from the perspective of the field/object dichotomy. Based on the assumption that a vague object can be viewed as the conceptualization of a field, we defined five categories of vague objects: (1) direct field-cutting objects, (2) focal operation-based field-cutting objects, (3) element-clustering objects, (4) object-referenced objects, and (5) dynamic boundary objects. We then established a categorization system to formalize the semantic differences between vague objects using the fuzzy set theory. The proposed framework provides valuable input for the conceptualization, interpretation, and modeling of vague geographical objects.
Figure. The categorization system of the five categories of fuzzy regions and their relations.
Recently, Dr. Laurel Legenza (PI) from the UW School of Pharmacy, Dr. Thomas R. Fritsche (Co-PI) from the Marshfield Medical Center and Professor Song Gao participating as a geospatial analysis scientist along with the State Cartographer’s Office (SCO) and other multidisciplinary collaborators, have been awarded a pilot grant from theUW Institute for Clinical and Translational Research (ICTR) and the Marshfield Clinic Research Institute for a research proposal titled “Geo-mapping antimicrobial resistance in E. coli from humans & animals” in Wisconsin.
The AMR Tracker tool, shown in the screenshot above, provides a map showing an array of antibiotics that might be prescribed to treat an infection (in this case, E.coli), and which one can be expected to work best in a specific geographic location. This could help doctors choose the right drug for their patients.
When a patient arrives at a hospital with an infection, his/her doctor must decide which antibiotic might have the best chance of curing him/her — no easy feat when disease-causing pathogens are increasingly resistant to multiple antibiotics. To make this data more accessible, a team of researchers at the University of Wisconsin–Madison School of Pharmacyand the State Cartographer’s Office have developed a prototype system that maps out trends in antibiotic resistance across the State of Wisconsin, which provides guidance at a glance of the likelihood a pathogen will respond to a particular drug.
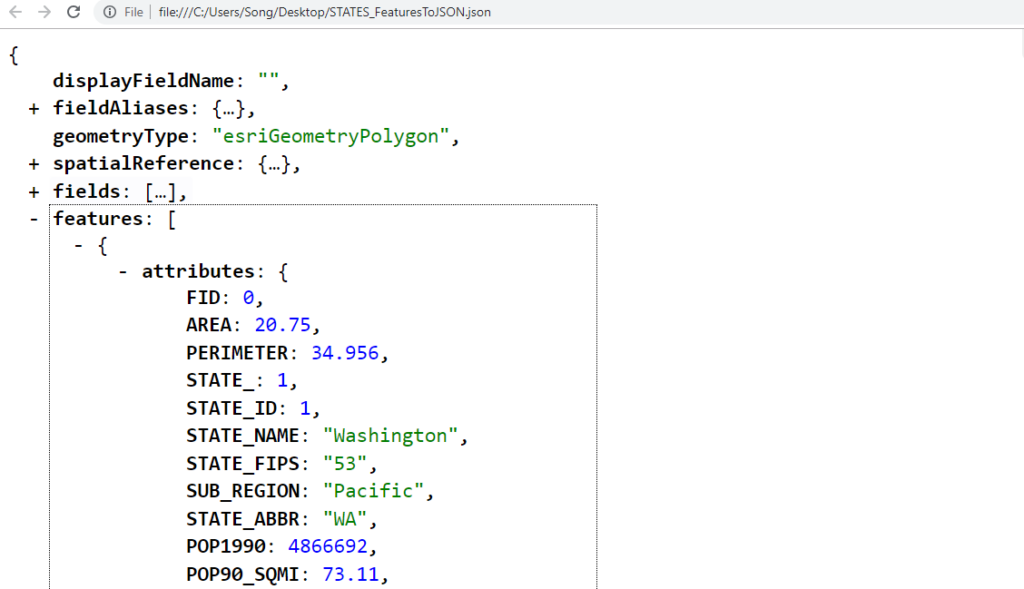
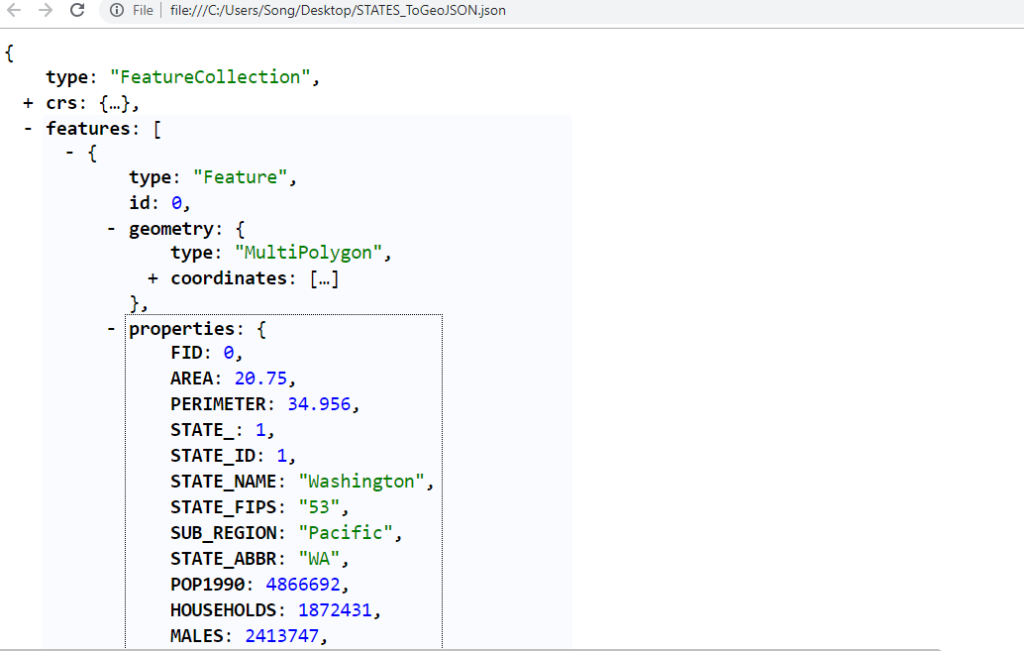
Some students asked me the question about the difference between Esri standard and the open standard in my course: Geospatial Big Data Analytics. The current ArcGIS conversion tool (in ArcMap not ArcGIS Pro) “JSON To Features” only supports its own format (aka Esri GeoJSON) and the structure is below:
And it is different from the open standard GeoJSON format from the Internet Engineering Task Force (IETF) working group, http://geojson.org/
It means that even if your GeoJSON is correctly generated, you won’t be able to convert it into a shapefile format using the ArcGIS conversion tool mentioned above.
Another option would be using ArcGIS Pro or the online tool for the conversion of open standard GeoJSON to shp:
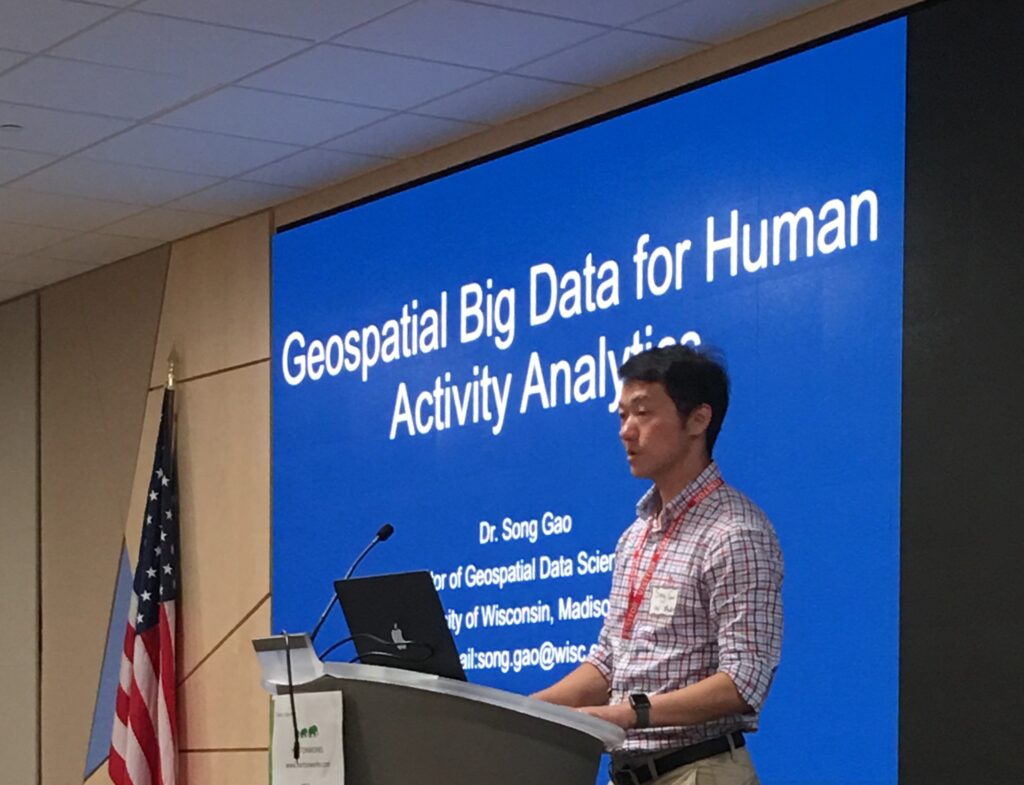
Professor Gao was invited by the Wisconsin Chapter of the Geospatial Information & Technology Association (GITA) and presented a guest lecture on the topic of “Geospatial Big Data for Human Mobility Analytics” at GITA 2018 Wisconsin Big Data and GIS Seminar.
In the Mobile Age, with the widespread use of location-awareness devices, it is possible to collect large-scale location-awareness datasets, such as mobile phone data, GPS-enabled taxi trajectories, and location-based social media data, to sense complex human movements and human-environment interactions in urban space. Here are some examples of research that we have been working on.
(1) Discovering Spatial Interaction Communities from Mobile Phone Data
This research attempts to explore and interpret patterns embedded in the network of phone‐call interaction and the network of phone‐users’ movements, by considering the geographical context of mobile phone cells. We adopt an agglomerative clustering algorithm based on a Newman‐Girvan modularity metric and propose an alternative modularity function incorporating a gravity model to discover the clustering structures of spatial‐interaction communities using a mobile phone dataset from one week in a city in China. The results verify the distance decay effect and spatial continuity that control the process of partitioning phone‐call interaction, which indicates that people tend to communicate within a spatial‐proximity community. Furthermore, we discover that a high correlation exists between phone‐users’ movements in physical space and phone‐call interaction in cyberspace. Our approach presents a combined qualitative‐quantitative framework to identify clusters and interaction patterns, and explains how geographical context influences communities of callers and receivers. The findings of this empirical study are valuable for urban structure studies as well as for the detection of communities in spatial networks.
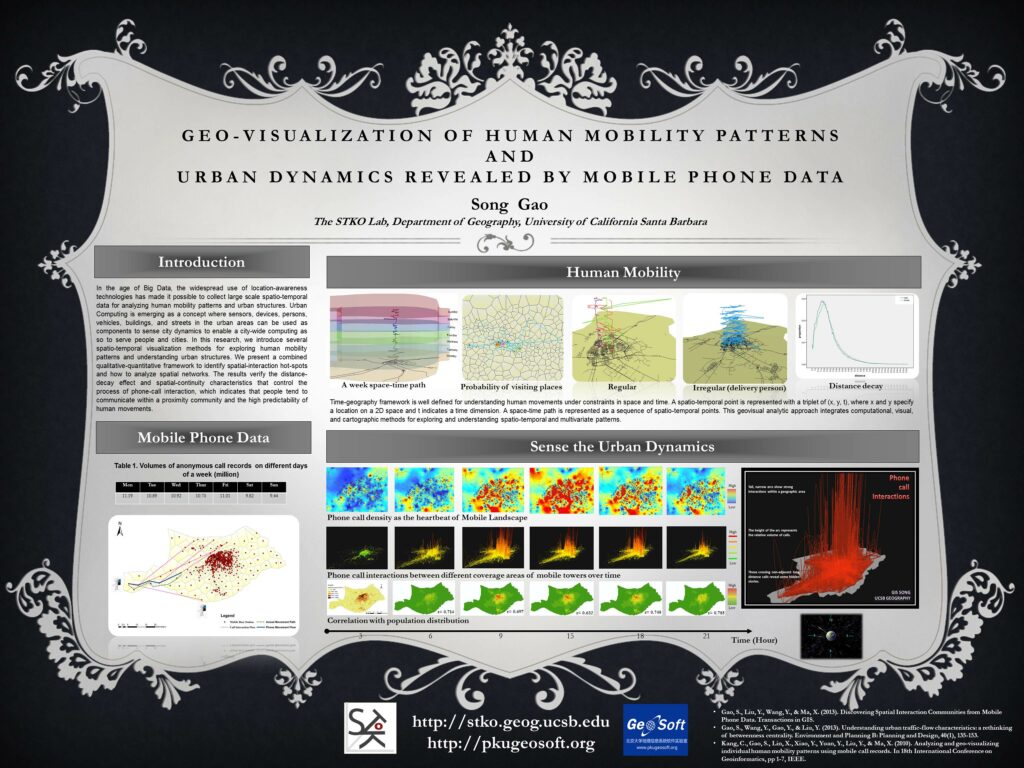
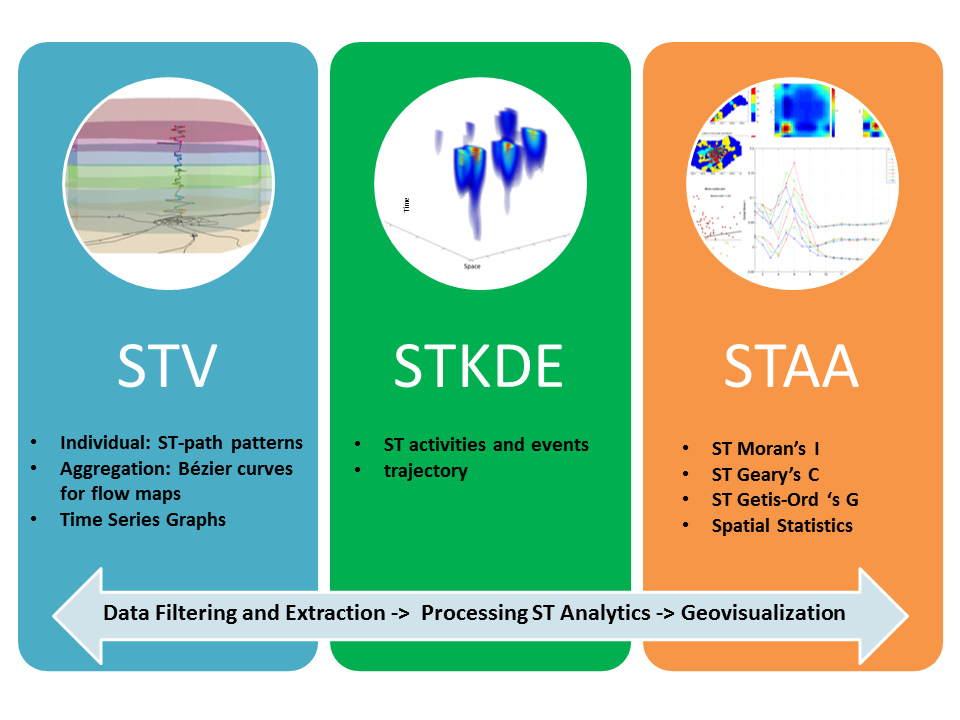
(2) Spatio-Temporal Analytics for Exploring Human Mobility Patterns and Urban Dynamics
In this research, we present a spatio-temporal analytical framework including spatiotemporal visualization (STV), space-time kernel density estimation (STKDE), and spatio-temporal-autocorrelation-analysis (STAA), to explore human mobility patterns and intra-urban communication dynamics. Experiments were conducted using large-scale detailed records of mobile phone calls in a city. The space-time path, time series graphs, vertical Bezier curves, STKDE, STAA, and related techniques in 3D GIS as well as statistical tests have been suggested for different spatio-temporal analysis tasks. We also investigated several statistical measures that extend the classic spatial association indices for spatio-temporal autocorrelation analysis. The spatial order of weighted matrix was found to have more significant effects than the temporal neighbors on influencing the autocorrelation strength of hourly phone calls.
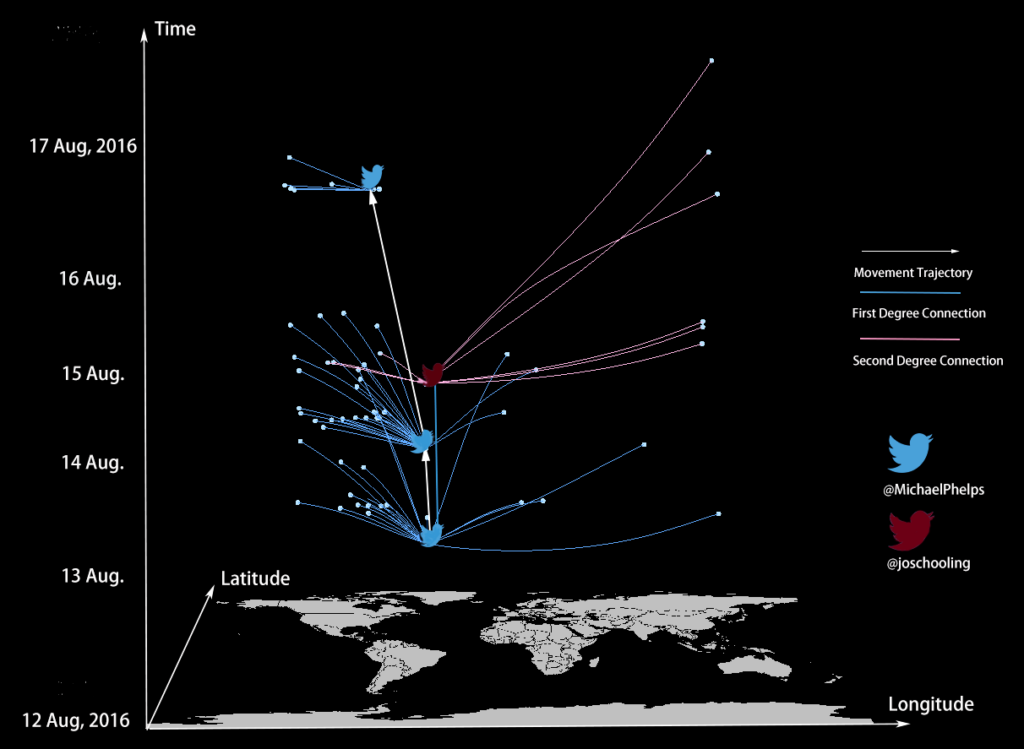
(3) Spatio-Temporal-Network Visualization for Exploring Human Movements and Interactions in Physical and Virtual Spaces
Spatiotemporal visualization techniques are effective in detecting human activity patterns over space and time, while social network analysis is good for exploring graph structures and interactions among individual nodes and groups. Integrating these two types of methods can facilitate the exploration of complex social networks in space and time, and can help discover hidden spatiotemporal and social connections. In this research, we propose a novel conceptual framework for spatiotemporal and social network visualization in a three-dimensional context. Based on this framework, new spatio-temporal-network (STN) quantitative metrics (including STN-impact-extent, STN-impact-center, STN-distance, STN-efficiency, and STN-centrality) are introduced to measure the underlying dynamic interactions among entities. The proposed framework aims to help better understand spatiotemporal patterns of human dynamics and social interactions over both physical and virtual spaces simultaneously, as well as explore how emerging events trigger spatial-temporal-social interactions and information diffusion from a process perspective. As a proof of concept, we demonstrate the proposed framework with a case study using geotagged tweets and associated visualization in the ArcScene software. We hope that this research can stimulate new insights on integrating multidisciplinary knowledge to explore human dynamics in a broader way.
(4) Uncovering the digital divide and the physical divide using mobile phone data
In this research, we first aim at developing data analytics that can derive insights about how people from different regions communicate and connect via mobile phone calls and physical movements. We uncover the digital divide (geographical segregation of phone communication patterns) and the physical divide (geographical limits of human mobility) in a developing country. The research also demonstrates that the chosen spatial unit and temporal resolution can affect the community detection results of spatial interaction graphs when analyzing human mobility patterns and exploring urban dynamics in the mobile age. We find that the daily detection has generated a more stable partition structure than an hourly one, while monthly changes also exist over time. The presented framework can help identify patterns of spatial interaction in both cyberspace and physical space with phone call detailed records in some regions where census data acquisition is difficult, especially in some developing countries.
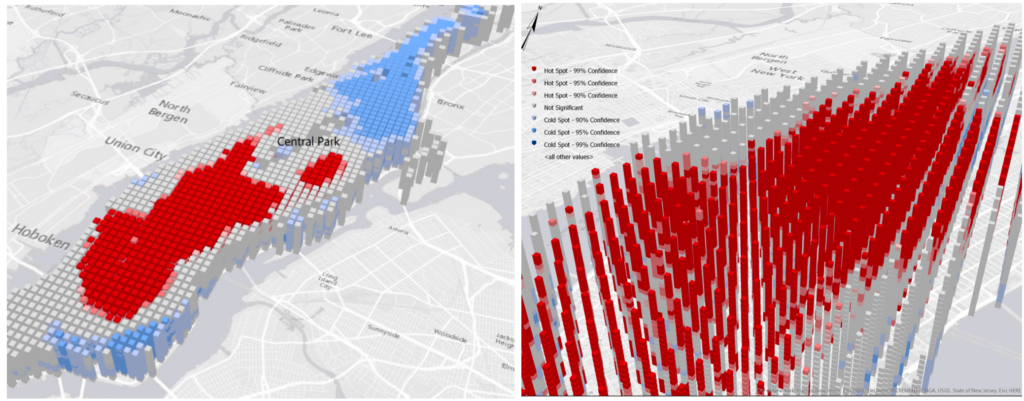
(5) Identifying Local Spatiotemporal Autocorrelation Patterns of Large-scale Taxi Pick-ups and Drop-offs
Analyzing spatiotemporal autocorrelation would be helpful to understand the underlying dynamic patterns in space and time simultaneously. In this work, we aim to extend the conventional spatial autocorrelation statistics to a more general framework considering both spatial and temporal dimensions. Specifically, we focus on the spatiotemporal version of Getis-Ord’s G*. The new indicator STG* can quantify the local association of adjacent features in space and time. As a proof of concept, the proposed method is applied in a large-scale GPS-enabled taxi dataset to identify local spatiotemporal autocorrelation patterns of taxi pick-ups and drop-offs in New York City.
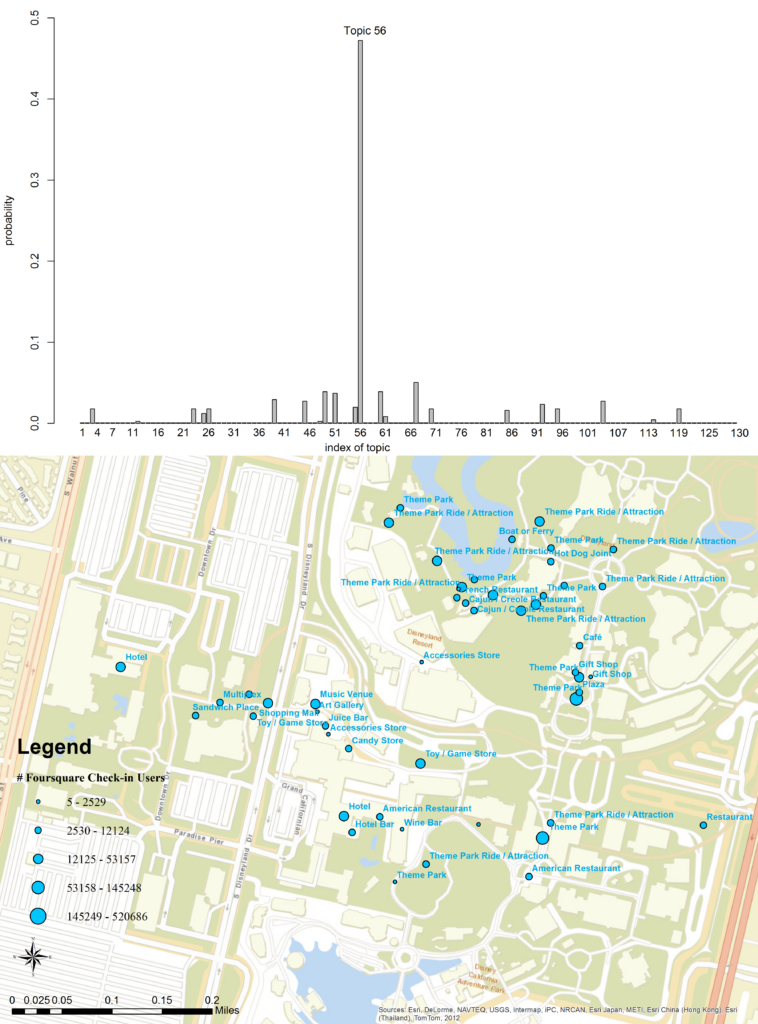
(6) Extracting urban functional regions from points of interest and human activities on location‐based social networks
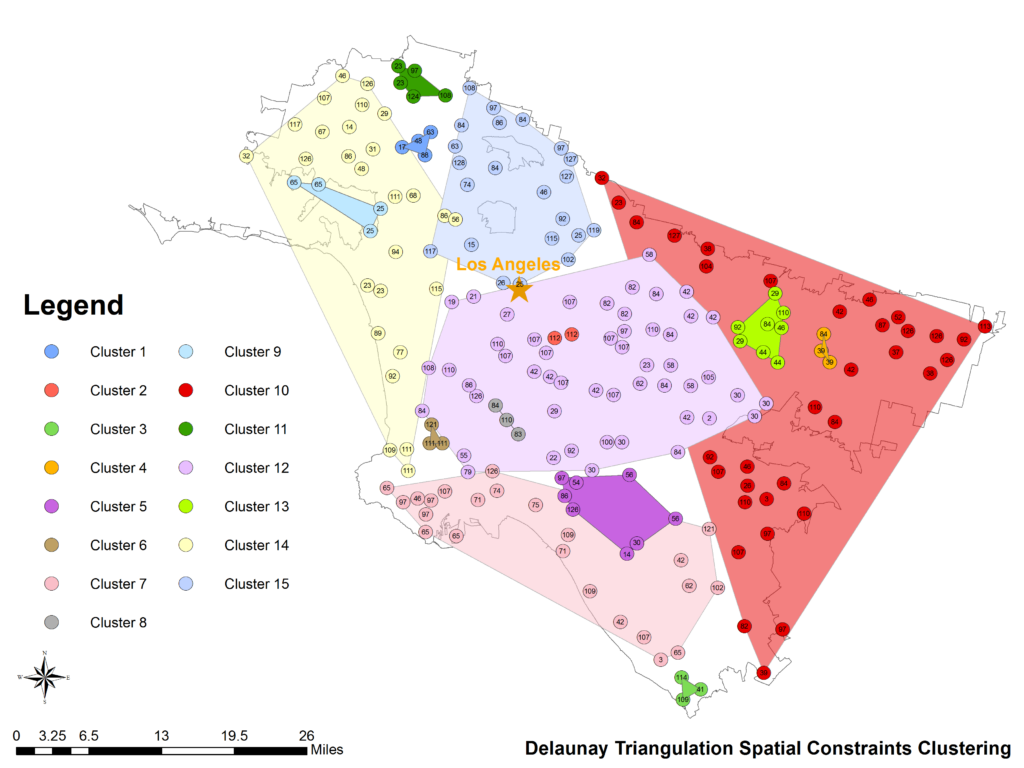
Data about points of interest (POI) have been widely used in studying urban land use types and for sensing human behavior. However, it is difficult to quantify the correct mix or the spatial relations among different POI types indicative of specific urban functions. In this research, we develop a statistical framework to help discover semantically meaningful topics and functional regions based on the co‐occurrence patterns of POI types. The framework applies the latent Dirichlet allocation (LDA) topic modeling technique and incorporates user check‐in activities on location‐based social networks. Using a large corpus of about 100,000 Foursquare venues and user check‐in behavior in the 10 most populated urban areas of the US, we demonstrate the effectiveness of our proposed methodology by identifying distinctive types of latent topics and, further, by extracting urban functional regions using K‐means clustering and Delaunay triangulation spatial constraints clustering. We show that a region can support multiple functions but with different probabilities, while the same type of functional region can span multiple geographically non‐adjacent locations. Since each region can be modeled as a vector consisting of multinomial topic distributions, similar regions with regard to their thematic topic signatures can be identified. Compared with remote sensing images which mainly uncover the physical landscape of urban environments, our popularity‐based POI topic modeling approach can be seen as a complementary social sensing view on urban space based on human activities.
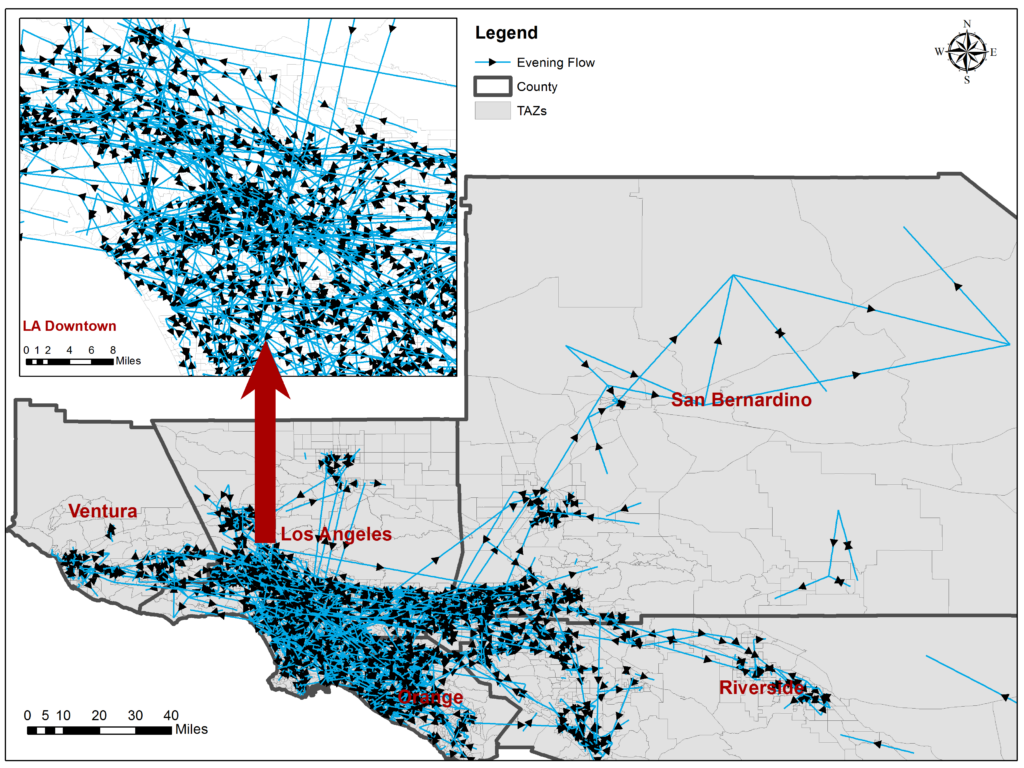
(7) Detecting Origin-Destination Mobility Flows From Geotagged Tweets
Human origin-to-destination (OD) trip information is of major importance in urban transportation modelling and infrastructure planning in order to optimize the use of street networks. The increasing use of social media like Twitter offers unprecedented opportunities to study individual activities and movements, to know where users are at which time, and what they are talking about. In this work we study the reliability of detecting regional OD trips from individual geotagged tweets in comparison with survey data in a quantitative manner, and explore the spatiotemporal flow patterns extracted from social media. We investigate the research question of whether OD trips mined from social media yield comparable results to expensive and labour intensive large-scale studies. To do so, we derive large-scale OD trips from geotagged tweets, aggregate them, and compare the results by correlating them to the American Community Survey data.
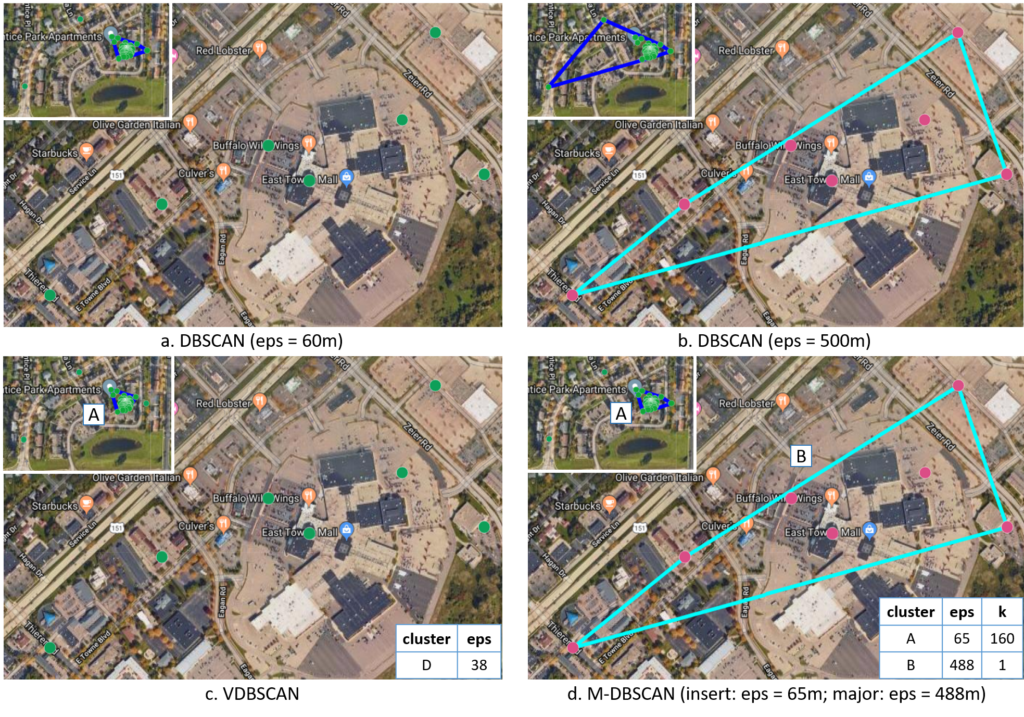
(8) Exploring the uncertainty of activity zone detection from Geotagged Tweets with multi-scaled DBSCAN (M-DBSCAN)
While exploring human mobility patterns based on digital footprints captured from social media, the density-based spatial clustering of applications with noise (DBSCAN) method is often used to identify activity zones which an individual regularly visits. However, DBSCAN is sensitive to the two parameters, including the search radius of a cluster (eps), and the minimum number of points (minpts). This research first discusses the uncertainty while detecting an individual’s activity zones through digital footprints. An improved density-based clustering algorithm for mobility analysis known asMulti-Scaled DBSCAN (M-DBSCAN), is then presented to mitigate the detection uncertainty of clusters produced by DBSCAN at different scales of density and cluster size. Next, we demonstrate that M-DBSCAN iteratively calibrates suitable local eps and minpts values instead of using one global parameter setting as DBSCAN for detecting clusters of varying densities, and proves to be very effective for detecting potential activity zones (clusters) with the historic geo-tagged tweets of selected users. Besides, M-DBSCAN can significantly reduce the noise ratio (the proportion of trajectory points not included in any cluster) by identifying all points capturing the activities performed in each zone. Using the historic geo-tagged tweets of a large number of users in Madison, Wisconsin and Washington, D.C., the results of M-DBSCAN and DBSCAN with a minpts value of 4 and varying eps values reveal that: 1) M-DBSCAN can capture dispersed clusters with low density of points, and therefore detecting more activity zones for each user and resulting in a lower noise ratio; 2) A value of 40m or higher should be used for eps in order to reduce the possibility of collapsing distinctive activity zones, and ensure a relatively low noise ratio during the clustering process; and 3) A value between 200m to 300m is recommended for eps while using DBSCAN for detecting activity zones from geotagged tweets.
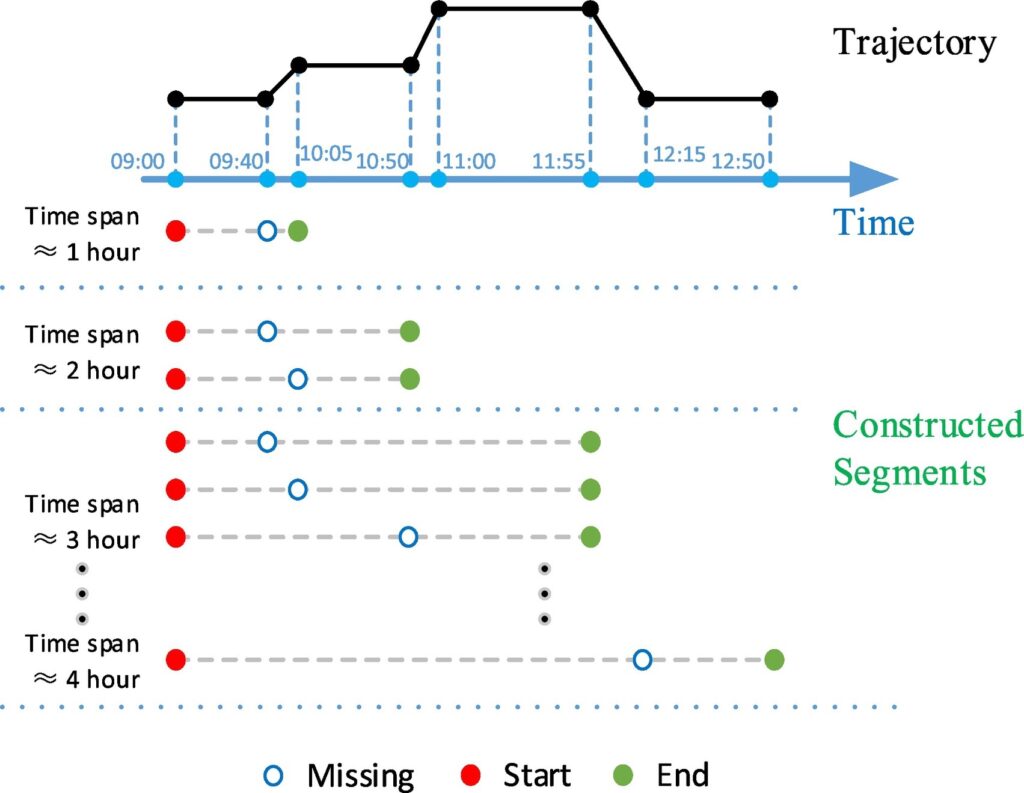
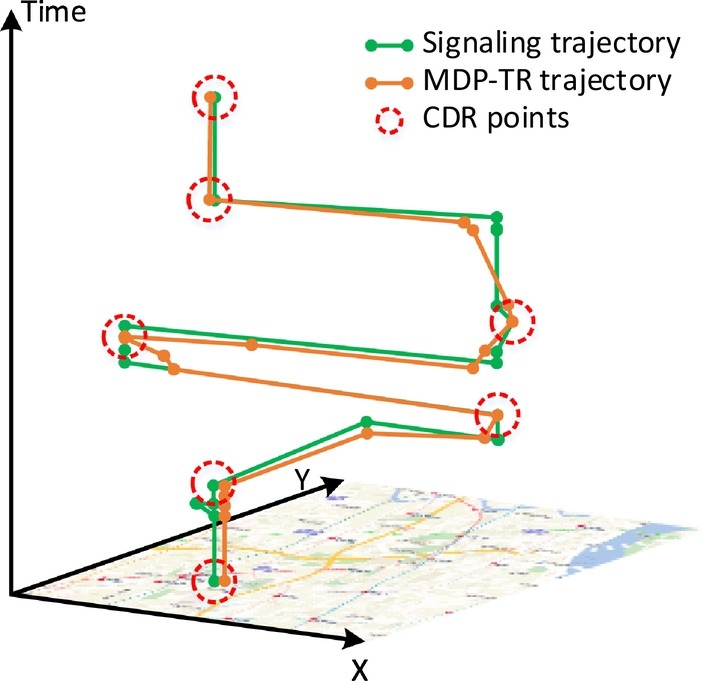
(9) Reconstruction of human movement trajectories from large-scale low-frequency mobile phone data
Understanding human mobility is significant in many fields, such as urban planning, transportation, and sociology. Due to the wide spatiotemporal coverage and low operational cost, mobile phone data have been recognized as a major resource for human mobility research. However, due to conflicts between the data sparsity problem of mobile phone data and the requirement of fine-scale solutions, trajectory reconstruction is of considerable importance. Although there have been initial studies on this problem, existing methods rarely consider the effect of similarities among individuals and the temporal patterns of missing data. To address this issue, we propose a novel multi-criteria data partitioning trajectory reconstruction (MDP-TR) method for large-scale mobile phone data. In this research, a multi-criteria data partitioning (MDP) technique is used to measure the similarity among individuals in near real-time and investigate the spatiotemporal patterns of missing data. With this technique, the trajectory reconstruction from mobile phone data is then conducted with classic machine learning models. We verified the method using a real mobile phone dataset in a large city. Results indicate that the MDP-TR method outperforms competing methods in both accuracy and robustness. We argue that the MDP-TR method can be effectively utilized for grasping highly dynamic human movement status and improving the spatiotemporal resolution of human mobility research.
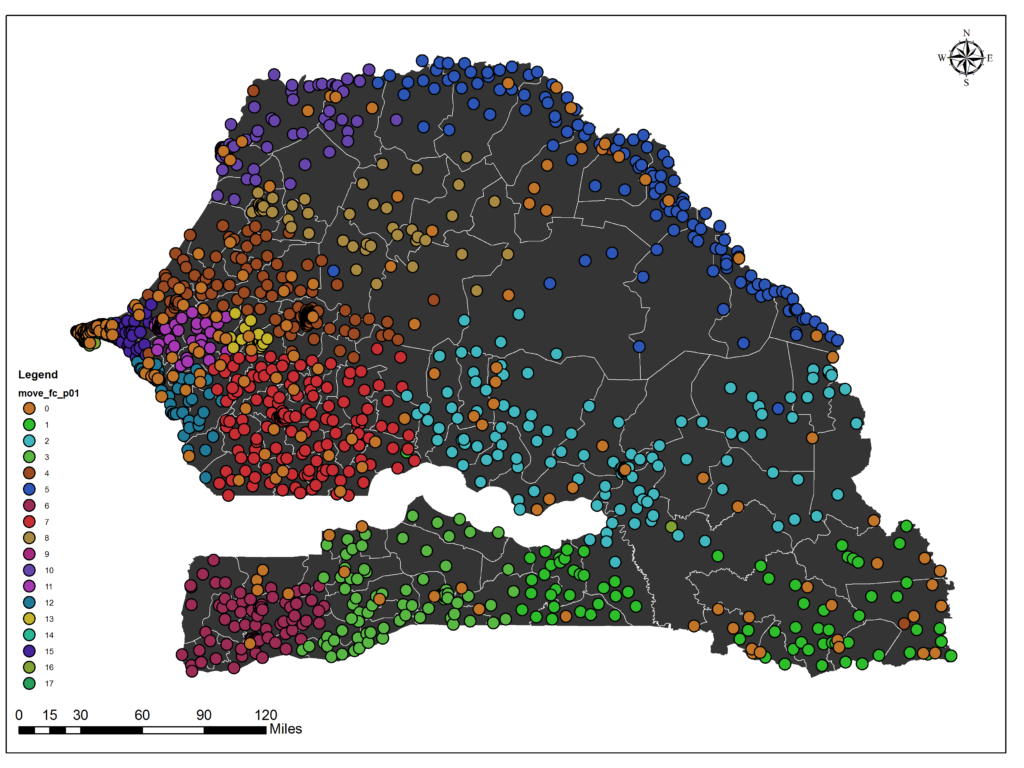
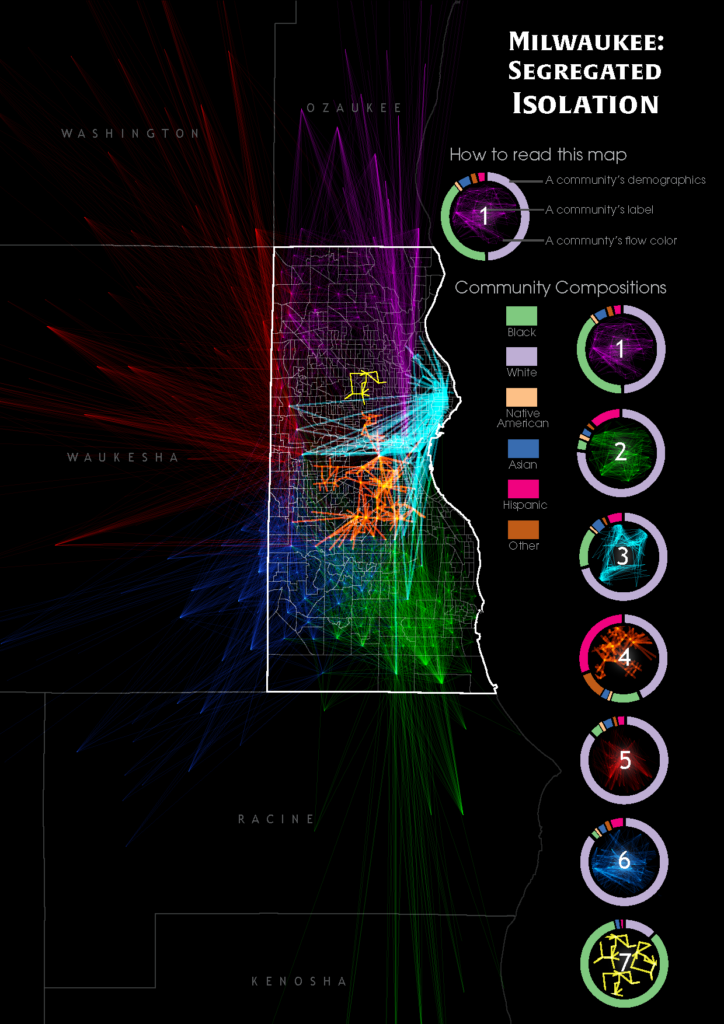
(10) Understanding neighborhood isolation through spatial interaction network analysis using location big data
Hidden biases of racial and socioeconomic preferences shape residential neighborhoods throughout the USA. Thereby, these preferences shape neighborhoods composed predominantly of a particular race or income class. However, the assessment of spatial extent and the degree of isolation outside the residential neighborhoods at large scale is challenging, which requires further investigation to understand and identify the magnitude and underlying geospatial processes. With the ubiquitous availability of location-based services, large-scale individual-level location data have been widely collected using numerous mobile phone applications and enable the study of neighborhood isolation at large scale. In this research, we analyze large-scale anonymized smartphone users’ mobility data in Milwaukee, Wisconsin, to understand neighborhood-to-neighborhood spatial interaction patterns of different racial classes. Several isolated neighborhoods are successfully identified through the mobility-based spatial interaction network analysis.
A street network is a system of interconnecting polylines and points (called edges and nodes in network science) that represent street segments/roads and intersections for a given area. It plays a very important role in transportation operation and management and many other fields. Below are some examples of research that we have been working on in this field.
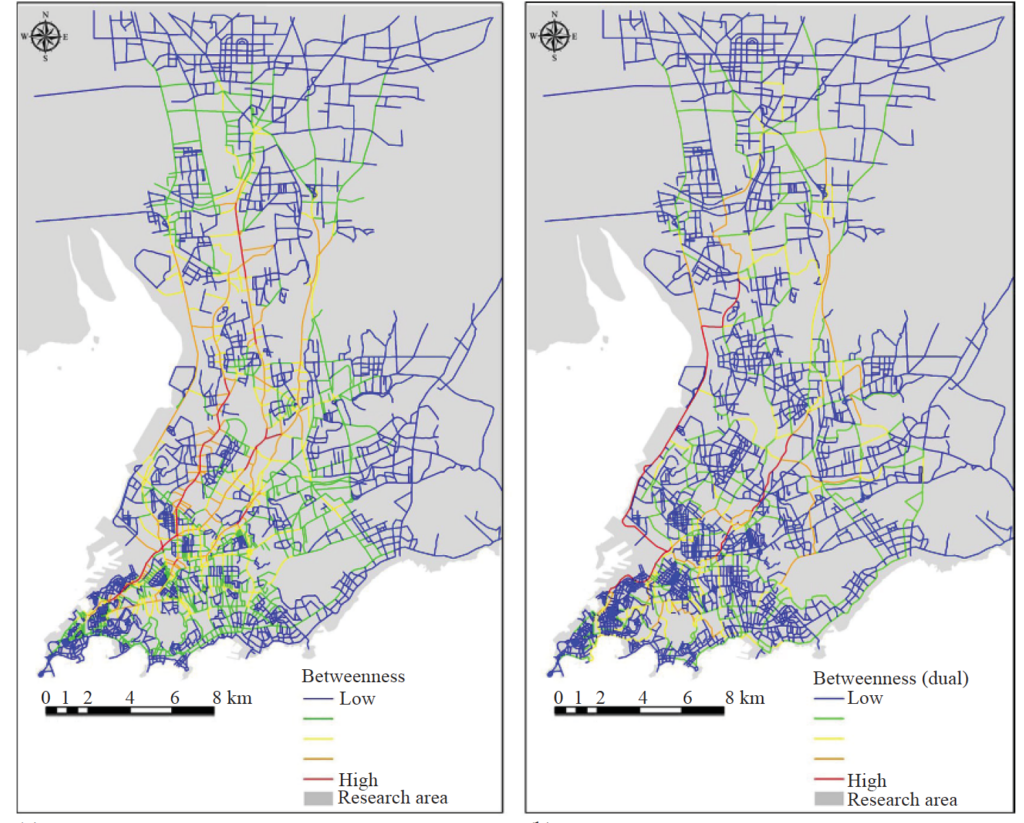
(1) Street Centrality and Traffic Flow
The structural and morphological properties of a street network, represented in topological or geographic metric measurements, are considered to be the key factors that shape dynamic urban traffic flow. Urban traffic flow can be seen as individual trips aggregately distributed in street networks. Each trip is generated from an origin and destination (OD) pair or multiple destinations with a network path connecting them. Generally, urban planners and transportation engineers rely on household questionnaires or transportation surveys on job–housing places for traffic-demand forecasting. With the rapid development of information and communication technology (ICT), the availability of large amounts of GPS (Global Positioning System) data and mobile phone data over time and space has increased the capability for monitoring, visualizing, analyzing, and modeling urban dynamics. In this research we investigate the spatial distribution of urban traffic flow based on taxi trajectories in a city in China and compute the correlation between urban traffic fl ow and street betweenness centrality. The results confirm that purely betweenness centrality is not an ideal measure for predicting urban traffic flow. We analyze the characteristics of betweenness and point out the ‘gap’ between betweenness centrality and actual flow. The gap is filled by a framework taking into account the distance decay and the spatial heterogeneity of human activities.
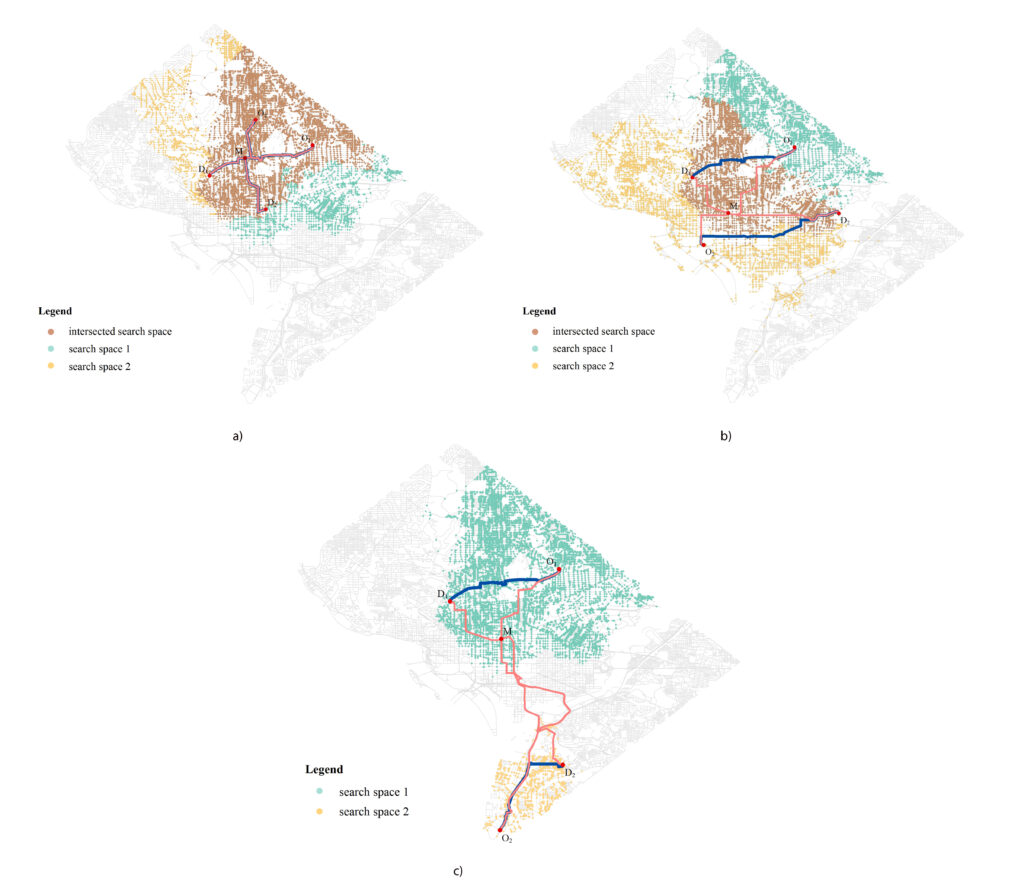
(2) Ride-sharing and Street Networks
Given different types of constraints on human life, people must make decisions that satisfy social activity needs. Minimizing costs (i.e. distance, time, or money) associated with travel plays an important role in perceived and realized social quality of life. Identifying optimal interaction locations (e.g., for ride-sharing) along road networks when there are multiple moving objects (MMO) with space–time constraints remains a challenge. In this research, we formalize the problem of finding dynamic ideal interaction locations for MMO as a spatial optimization model and introduce a context-based geoprocessing heuristic framework to address this problem.
(3) Spatial Interactions along Street Networks
Researchers have proposed many methods to investigate the spatial interactions derived from human movements, such as the gravity model and the radiation model. However, most studies have mainly focused on the interactions among areal units at an aggregated level, neglecting that in most cases, human movements are carried by vehicles and constrained by the underlying road networks. To fill this gap, we propose a novel approach to identify spatial interaction patterns of vehicle movements along urban road networks.
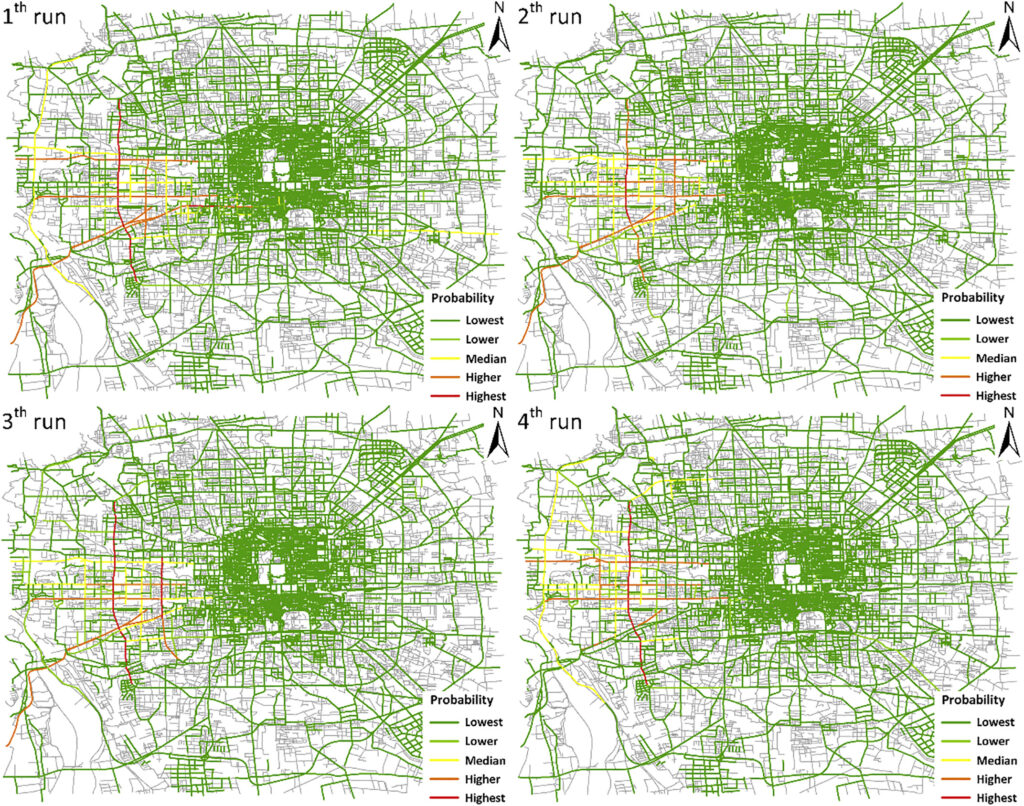
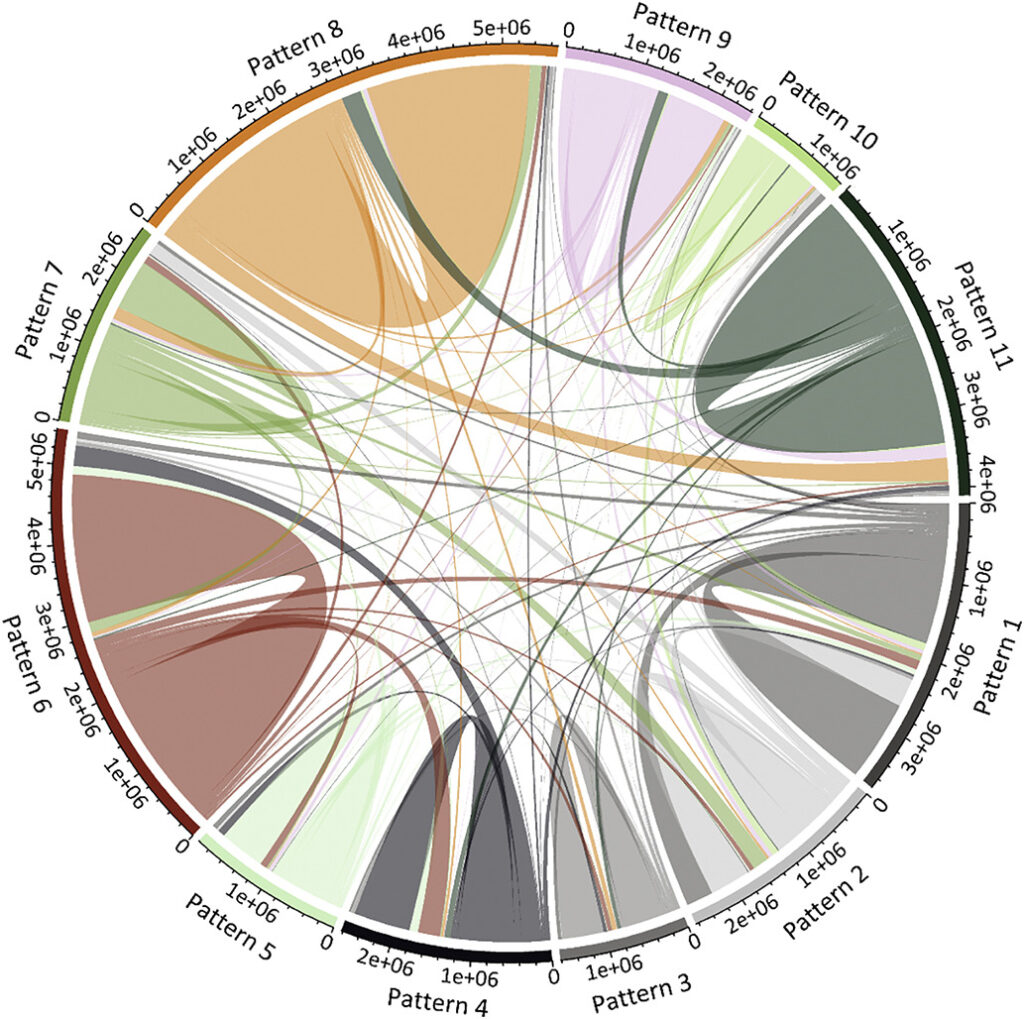
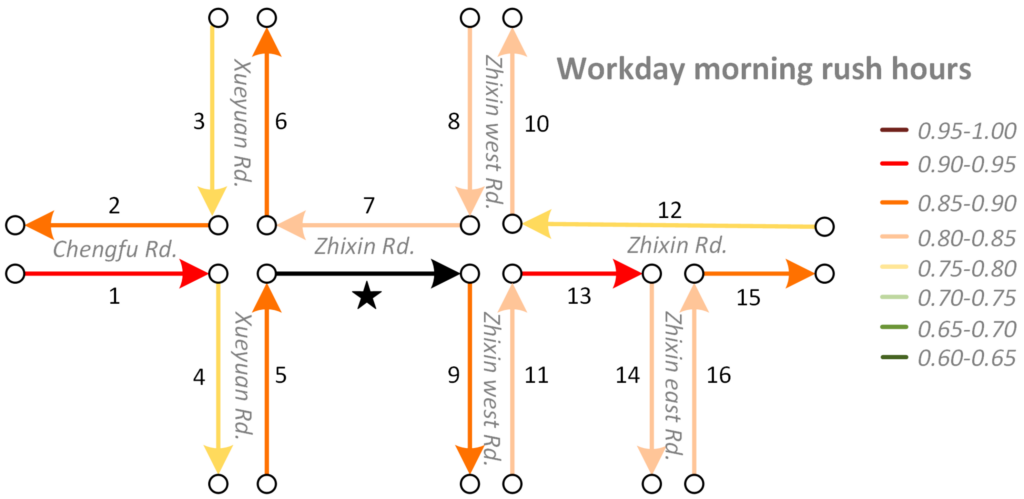
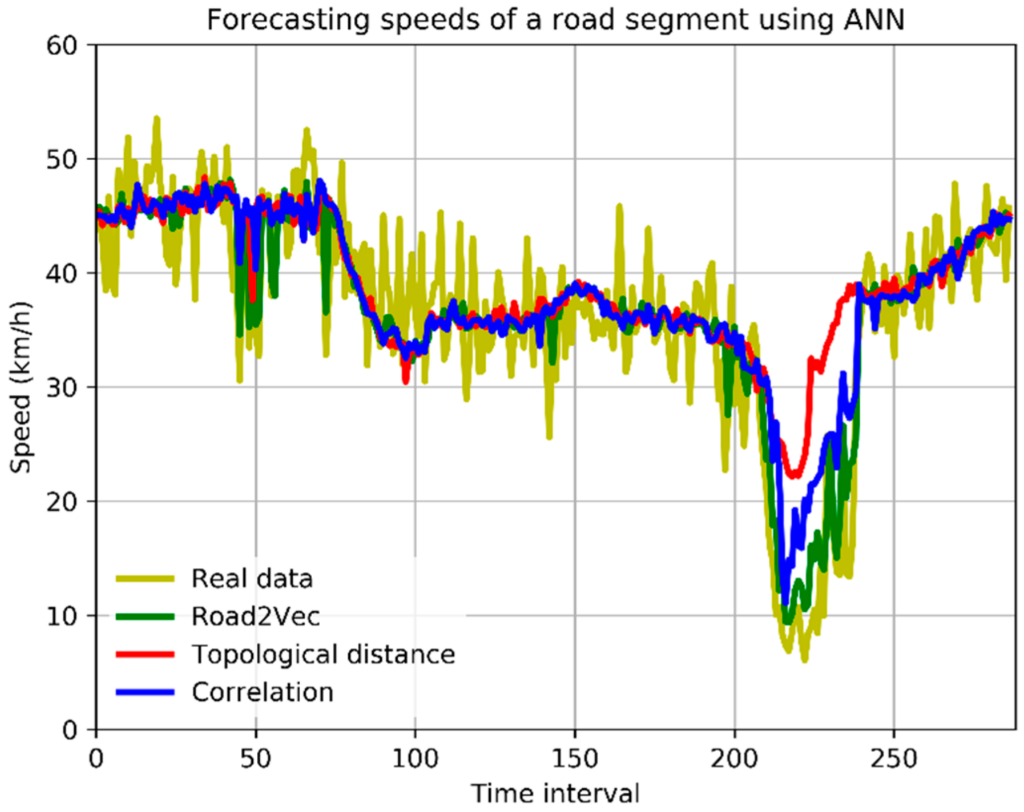
Good characterization of traffic interactions among urban roads can facilitate traffic-related applications, such as traffic control and short-term forecasting. Most studies measure the traffic interaction between two roads by their topological distance or the correlation between their traffic variables. However, the distance-based methods neglect the spatial heterogeneity of roads’ traffic interactions, while the correlation-based methods cannot capture the non-linear dependency between two roads’ traffic variables. In this paper, we propose a novel approach called Road2Vec to quantify the implicit traffic interactions among roads based on large-scale taxi operating route data using a Word2Vec model from the natural language processing (NLP) domain. A case study on short-term traffic forecasting is conducted with artificial neural network (ANN) and support vector machine (SVM) algorithms to validate the advantages of the presented method. The results show that the forecasting achieves a higher accuracy with the support of the Road2Vec method than with the topological distance and traffic correlation based methods.
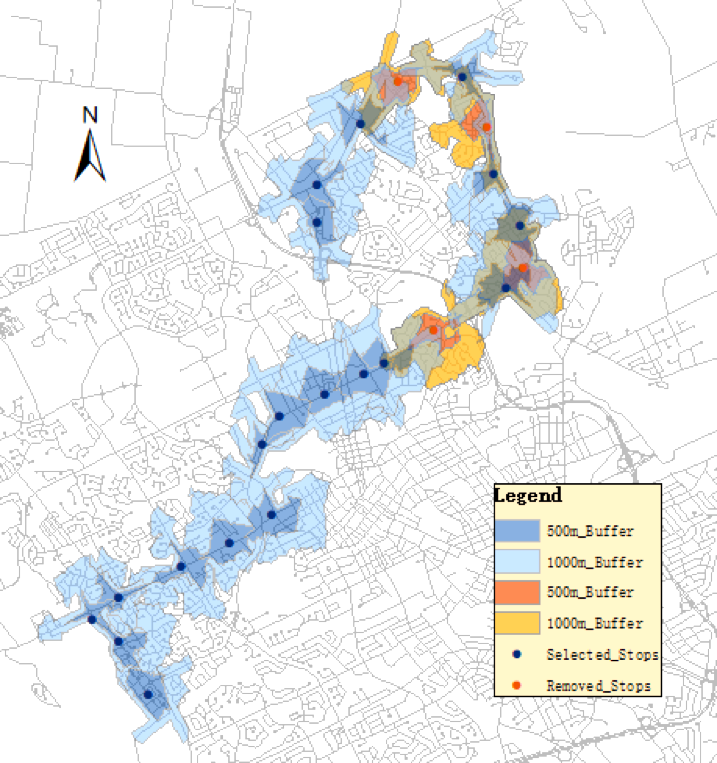
(4) Public Transportation Optimization
Public transportation systems, in particular, bus systems, play an essential role in the process of urbanization. Typically more bus stops enable more people to access the bus whereas lower the efficiency of bus system. We utilize spatial optimization techniques to address this issue.
In one of our studies, we use the Spatial Interaction Coverage (SIC) model to identify and remove redundant bus stops while maintain the overall success of the whole bus system. The SIC model aims to model the relationship between demand points and bus stops. It takes factors such as the distance and the attractiveness of each bus stop into consideration. By applying the SIC model to the iXpress 202 route in Kitchener-Waterloo region in Canada, we can effectively identify the number of stops to maintain and remove redundant stops. The bus operation efficiency can be increased by 7.28% after optimization. The relationships between bus ridership and the socioeconomic variables (population, income, and age) in the study area are also analyzed. We are expanding our research to multiple cities with the consideration of multi-route buses and multi-mode transportation.
(5) Regional Economy and Transportation Network Analytics
With the booming economy in China, many researches have pointed out that the improvement of regional transportation infrastructure among other factors had an important effect on economic growth. Utilizing a large-scale dataset which includes 3.5 billion entry and exit records of vehicles along highways generated from toll collection systems, we attempt to establish the relevance of mid-distance land transport patterns to regional economic status through transportation network analyses. We apply standard measurements of complex networks to analyze the highway transportation networks. A set of traffic flow features are computed and correlated to the regional economic development indicator. The multi-linear regression models explain about 89% to 96% of the variation of cities’ GDP across three provinces in China. We then fit gravity models using annual traffic volumes of cars, buses, and freight trucks between pairs of cities for each province separately as well as for the whole dataset. We find the temporal changes of distance-decay effects on spatial interactions between cities in transportation networks, which link to the economic development patterns of each province. We conclude that transportation big data reveal the status of regional economic development and contain valuable information of human mobility, production linkages, and logistics for regional management and planning. Our research offers insights into the investigation of regional economic development status using highway transportation big data.
Funded by UW-Madison Office of the Vice Chancellor for Research and Graduate Education (VCRGE) and the Wisconsin Alumni Research Foundation (WARF).
Abstract:
Place names and the semantics of places described in natural languages rather than coordinates (i.e., longitude and latitude) are pervasive in human discourse, documents, and social media while location needs to be specified for mapping or interlinking other information. However, there is still a gap between the informal or vague cognition expressions of place (e.g., downtown, neighborhood, up north Wisconsin) and the formal computational representations of place in computerized information systems. Cognitive regions and places are notoriously difficult to represent in geographic information science and systems. They arise from the complex interactions of individuals, society, and the environment.
The emergence of big data brings new opportunities to better understand our geographic and socioeconomic environments. In this research, we will synthesize multi-source datasets from census, location-based social networks, news media, Wikipedia, travel blogs, and other open data websites, and utilizing the theory of place, natural language processing, machine learning, and visualization techniques for extracting and representing vague cognitive places. The research will also help better understand individuals’ observations, experiences, and exposures to different types of places and ambient social environments.
Gao, S., Janowicz, K., McKenzie, G., & Li, L. (2013, November). Towards Platial Joins and Buffers in Place-Based GIS. In Proceedings of The First ACM SIGSPATIAL International Workshop on Computational Models of Place (pp. 42-49).
A specialissue on “Place-Based Research in GIScience and Geoinformatics” recently published on the ISPRS International Journal of Geo-Information (ISSN 2220-9964). It consists of 12 peer-reviewed articles relevant to the topic, co-edited by Professor Thomas Blaschke and Professor Song Gao.
Congratulations to Yuhao Kang and Yunlei Liang for their paper acceptance! Check “Publication” for more details.
“Utilizing Reverse Viewshed Analysis in Image Geo-Localization”by Yuhao Kang, Song Gao, and Yunlei Liang, has been accepted at the 2nd ACM SIGSPATIAL International Workshop on Recommendations for Location-based Services and Social Networks (LocalRec 2018).
“Optimizing Bus Stop Spacing Using the Simulated Annealing Algorithm with Spatial Interaction Coverage Model“, by Yunlei Liang, Song Gao, Tianyu Wu, Sujing Wang and Yuhao Wu, has been accepted for presentation at the 11th ACM SIGSPATIAL International Workshop on Computational Transportation Science (IWCTS 2018).