Prof. Gao received a NSF RAPID grant in response to COVID-19

Recently, a multidisciplinary research team led by Prof. Song Gao (Geography) who serves as the Principal Investigator (PI) and collaborates with three other Co-PIs at UW-Madison: Prof. Kaiping Chen (Life Sciences Communication), Prof. Qin Li (Mathematics), and Prof. Jonathan Patz (Population Health Sciences), was awarded an NSF RAPID grant in response to the COVID-19 pandemic. The project title is: “Geospatial Modeling of COVID-19 Spread and Risk Communication by Integrating Human Mobility and Social Media Big Data”.

This project will investigate the gap between the science of epidemic modeling and risk communication to the general public in response to the COVID-19 pandemic. With the rapid development of information, communication, and technologies, new data acquisition and assessment methods are needed to evaluate the risk of epidemic transmission and geographic spreading from the community perspective, to help effectively monitor social distancing policies, and to understand social disparities and environmental contexts in risk communication. This project will make theoretical, methodological, and practical contributions that advance the understanding of the COVID-19 spread across both time and space. The communication aspects of this research will serve to educate communities about the science, timing, and geography of virus transmission in order to enhance actions for addressing such global health challenges. This project explores the capabilities and potential of integrating social media big data and geospatial artificial intelligence (GeoAI) technologies to enable and transform spatial epidemiology research and risk communication. Results will be disseminated broadly to multiple stakeholder groups. Further, this project will support both researchers and students from underrepresented groups, broadening participation in STEM fields. Lastly, the Web platform developed in this project will serve as an education tool for students in geography, communication, mathematics, and public health, as well as for effectively engaging with communities about the science of COVID-19.

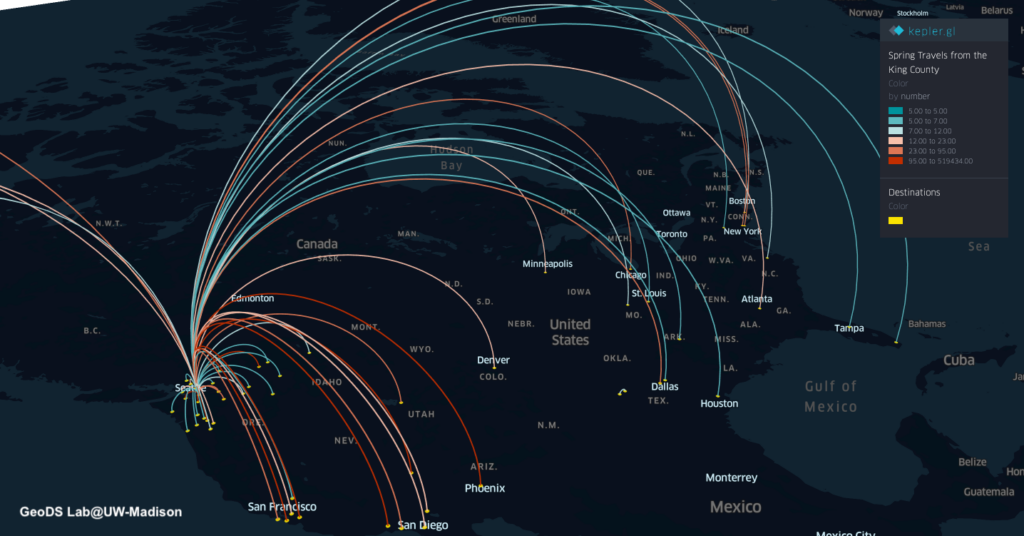
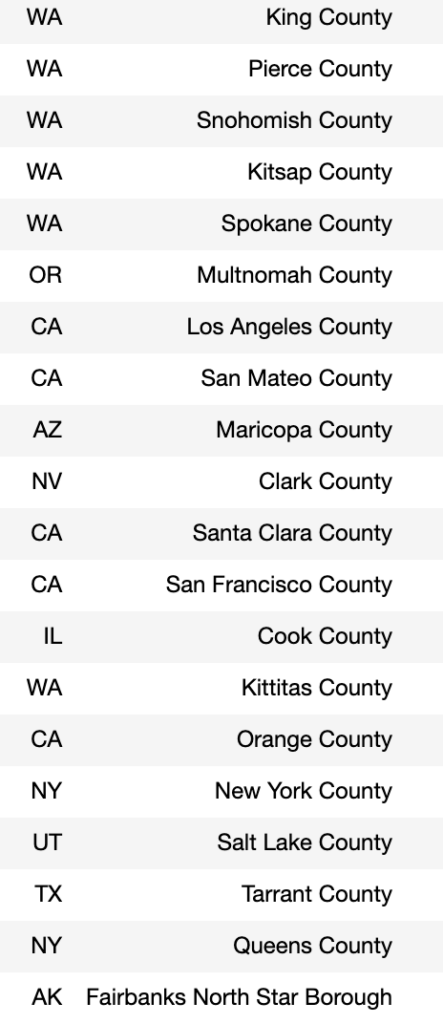
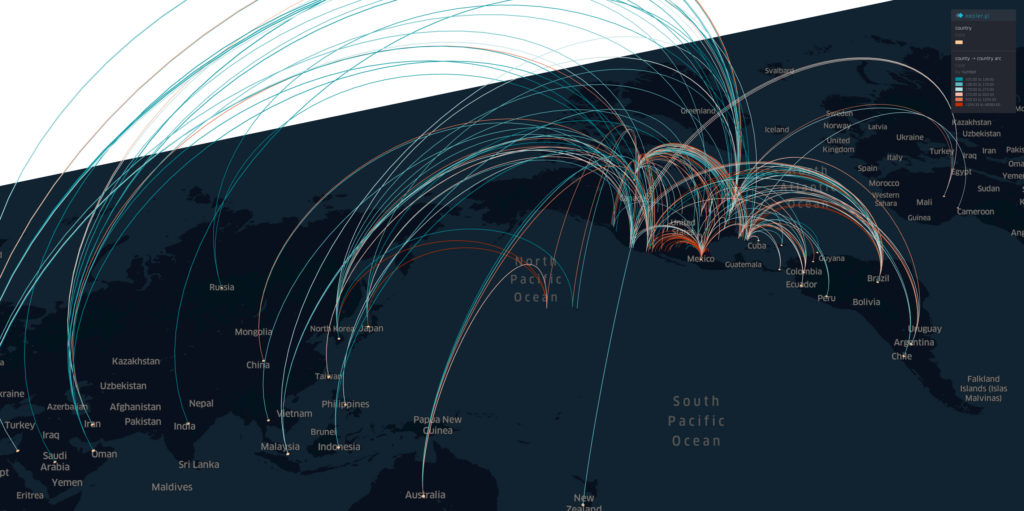
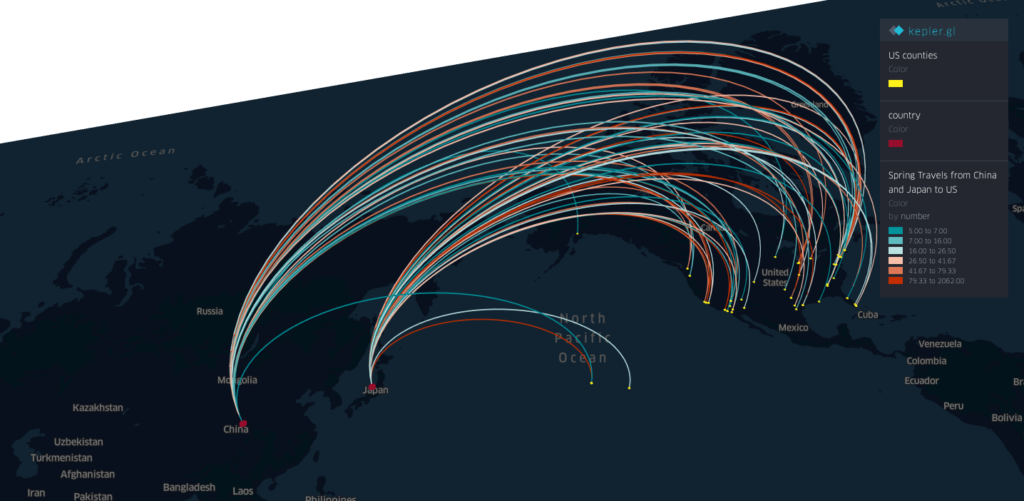
Past health research mainly focuses on quantitative modeling of human transmission using various epidemic models. How to effectively communicate the science of an epidemic outbreak to the general public remains a challenge. When an epidemic outbreak occurs without specific controls in place, it can be particularly challenging to improve community risk awareness and action. The research team, composed of experts from geography, mathematics, public health and life sciences communication will (1) develop innovative mathematical predictive models that integrate spatio-temporal-social network information and community-centered approaches; (2) integrate census statistics, human mobility and social media big data, as well as policy controls to conduct data-synthesis-driven and epidemiology-guided risk analysis; And (3) utilize panel surveys and text mining techniques on social media data for better understanding public awareness of COVID-19 and for investigating various instant message and visual image strategies to effectively communicate about risks to the public. The results of this project will lead to a better understanding of the geography and spread of COVID-19. Additionally, it is expected that the methods developed in this project can be applied to mitigate the outbreak risks of future epidemics.

The research team will also collaborate with The Wisconsin State Cartographer’s Office (SCO), The Wisconsin Department of Health Services (DHS), The American Family Insurance Data Science Institute (DSI), and The Global Health Institute (GHI).

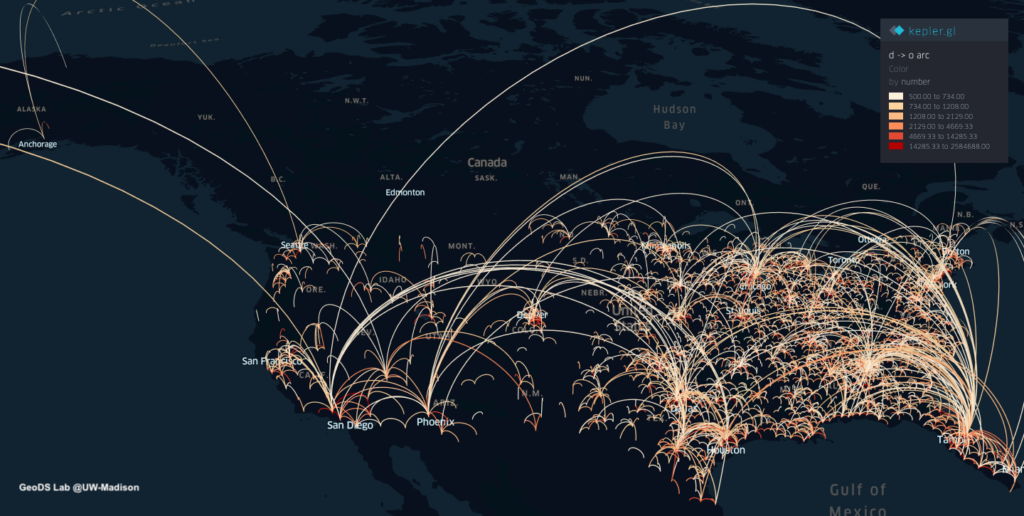
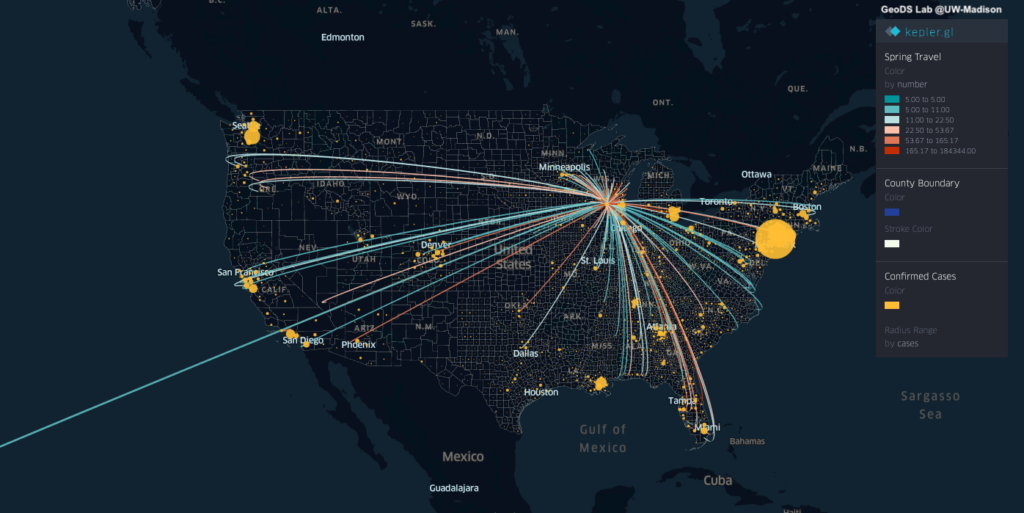
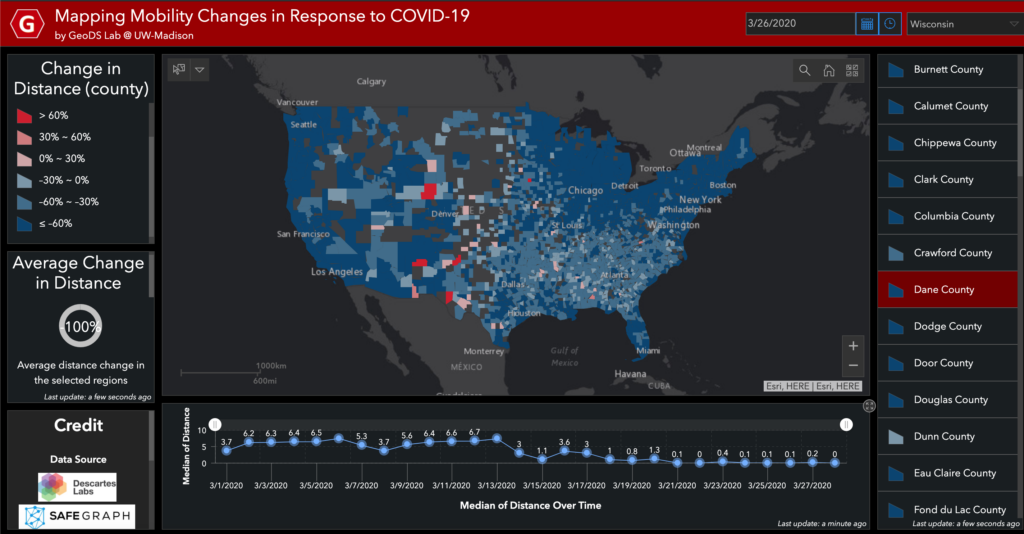
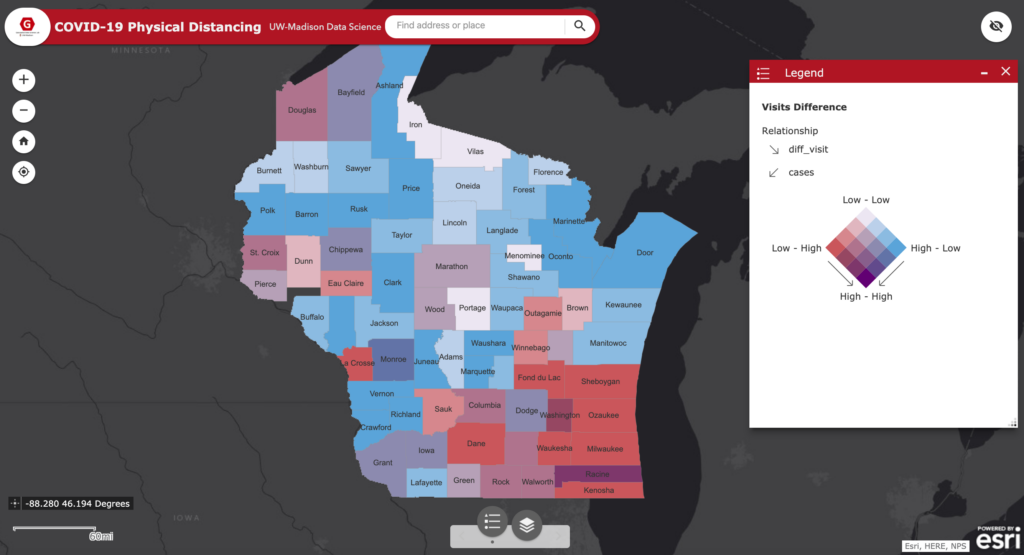
Read our recent work: Mobile location big data can help predict the potential infected areas as coronavirus spreads


Mobile location big data can help predict the potential infected areas as coronavirus spreads

The travels and close contact-tracing from/to infected communities is useful for identifying potential hotspots and assessing the potential risk across different places. A recent research published in Science showed that “substantial undocumented infection facilitates the rapid dissemination of novel coronavirus (SARS-CoV2) “. Understanding the human physical movement patterns and social contacts is a key for saving more lives as one may be surrounded by latent exposed people who don’t show SARS-CoV2 symptoms. Therefore, human mobility patterns and changes could be one indicator for understanding the status of physical social distancing. Here are the neighborhood mobility pattern and the Spring 2019 and March 2020 travel patterns for US cities and counties using the anonymized and aggregated mobile phone location big data in collaboration with SafeGraph, which covers over 3.6 million points of interest (POI) and business venues with visit patterns. Meanwhile, we are working on the whole US 2020 census block data and monitoring new infected areas from the CDC and from a list of Coronavirus dashboards in response to COVID-19.

Reference: Gao, S., Rao, J., Kang, Y., Liang, Y., & Kruse, J. (2020). Mapping county-level mobility pattern changes in the United States in response to COVID-19. SIGSPATIAL Special. 12(1), 16-26.

The spatial density distribution of over 3.6 million SafeGraph POIs with visit patterns.

The U.S. government, tech industry are discussing ways to harness smartphone location data to combat the novel coronavirus (COVID-19).

You can find out where people from those POIs / neighborhoods / a county connecting with other neighborhoods and counties across the US. By comparing the POI visits between last March and March 2020, we can summarize the changes and visualize the patterns on the maps to understand whether people in each County/State has reacted to (Physical) Social Distancing.

Interactive Web: Mapping Human Mobility Changes at the County level since March 1, 2020

Mapping Human Mobility Changes at the County level in March, 2020 (Data Source: Descartes Labs )
See also: https://www.nytimes.com/interactive/2020/03/23/opinion/coronavirus-economy-recession.html

Interactive Web on COVID-19 Physical Distancing and the relation with the infectious cases in Wisconsin (Using the latest SafeGraph weekly movement patterns in March 2020): https://geods.geography.wisc.edu/covid19/WI/

In addition, the maps below show the origin-destination (OD) flows larger than a travel frequency threshold at different spatial scales. The one at the urban scale can help understand the potential spread and hotspots in a city/metropolitan area.

Interactive Web: geods.geography.wisc.edu/covid19/King_WA.html (Notice that some paired neighborhood-to-neighborhood flows are not shown after the data filtering based on OD flow frequency)
Interactive Web: https://geods.geography.wisc.edu/covid19/King_US.html (neighborhood mobility to San Francisco, Alaska, Boston, and New York, etc. stand out. )

Spring Travel Risk

By using the county-level Spring travel data in March, we can see thousands of trips generated from the U.S. counties in the Spring season and widely across the U.S., which may help explain the rapid growth of infection cases across the whole U.S. Our travel-augmented SEIR epidemic modeling results showed that only about 20% of infected cases reported (with testing) at the state level in the US.

Chen, S., Li, Q., Gao, S., Kang, Y.,& Shi, X.(2020). State-specific Projection of COVID-19 Infection in the United States and Evaluation of Three Major Control Measures. Scientific Reports, 1-9, www.nature.com/articles/s41598-020-80044-3.

Interactive Web demo: Dane County, WI

The spring travels from the Dane County, WI with current U.S. confirmed cases: http://geods.geography.wisc.edu/covid19/WI_DaneCounty.html

Interactive Web: The King County, WA https://geods.geography.wisc.edu/covid19/KingCounty_Spring.html

Spring travels patterns aggregated at the Country-level in March 2019 from the people who reside in the King County, WA
Spring travels patterns aggregated at the County-level in March 2019 from the people who reside in the King County, WA
(Zoom in to the Pacific Coast Map) Spring travels patterns aggregated at the County-level in March 2019 from the people who reside in the King County, WA

The following table shows the top 20 counties which the people reside in the King County traveled to in March 2019.

And using the Country-to-US Counties flow data from last March, we can assess how the global travels from other countries outside of US will influence the potential coronavirus outbreak and spread in the US.

The spring international travels to US in March 2019. (filtered by at least 100 people)
The spring travels from China and Japan in March 2019.

Credit: The data sources were from SafeGraph Inc., Descartes Labs, and the Web geovisualization was created using the Kepler.gl tool.

Acknowledgment: We would like to thank all individuals and organizations for collecting and updating the COVID-19 observation data and reports. Dr. Song Gao acknowledges the funding support provided by the National Science Foundation (Award No. 2027375). Any opinions, findings, and conclusions or recommendations expressed in this material are those of the author(s) and do not necessarily reflect the views of the National Science Foundation.

Dynamic Estimation of Individual Exposure Levels to Air Pollution Using Mobile Phone Data

Mingxiao Li, Song Gao, Feng Lu, Huang Tong, Hengcai Zhang. (2019) Dynamic Estimation of Individual Exposure Levels to Air Pollution Using Trajectories Reconstructed from Mobile Phone Data. International Journal of Environmental Research and Public Health. 16(22), 4522. DOI: 10.3390/ijerph16224522

Abstract: The spatiotemporal variability in air pollutant concentrations raises challenges in linking air pollution exposure to individual health outcomes. Thus, understanding the spatiotemporal patterns of human mobility plays an important role in air pollution epidemiology and health studies. With the advantages of massive users, wide spatial coverage and passive acquisition capability, mobile phone data have become an emerging data source for compiling exposure estimates. However, compared with air pollution monitoring data, the temporal granularity of mobile phone data is not high enough, which limits the performance of individual exposure estimation. To mitigate this problem, we present a novel method of estimating dynamic individual air pollution exposure levels using trajectories reconstructed from mobile phone data. Using the city of Shanghai as a case study, we compared three different types of exposure estimates using (1) reconstructed mobile phone trajectories, (2) recorded mobile phone trajectories, and (3) residential locations. The results demonstrate the necessity of trajectory reconstruction in exposure and health risk assessment. Additionally, we measure the potential health effects of air pollution from both individual and geographical perspectives. This helped reveal the temporal variations in individual exposures and the spatial distribution of residential areas with high exposure levels. The proposed method allows us to perform large-area and long-term exposure estimations for a large number of residents at a high spatiotemporal resolution, which helps support policy-driven environmental actions and reduce potential health risks.

Funded Project: Geo-mapping antimicrobial resistance in E. coli from humans & animals in Wisconsin

Recently, Dr. Laurel Legenza (PI) from the UW School of Pharmacy, Dr. Thomas R. Fritsche (Co-PI) from the Marshfield Medical Center and Professor Song Gao participating as a geospatial analysis scientist along with the State Cartographer’s Office (SCO) and other multidisciplinary collaborators, have been awarded a pilot grant from the UW Institute for Clinical and Translational Research (ICTR) and the Marshfield Clinic Research Institute for a research proposal titled “Geo-mapping antimicrobial resistance in E. coli from humans & animals” in Wisconsin.

The AMR Tracker tool, shown in the screenshot above, provides a map showing an array of antibiotics that might be prescribed to treat an infection (in this case, E.coli), and which one can be expected to work best in a specific geographic location. This could help doctors choose the right drug for their patients.

When a patient arrives at a hospital with an infection, his/her doctor must decide which antibiotic might have the best chance of curing him/her — no easy feat when disease-causing pathogens are increasingly resistant to multiple antibiotics. To make this data more accessible, a team of researchers at the University of Wisconsin–Madison School of Pharmacy and the State Cartographer’s Office have developed a prototype system that maps out trends in antibiotic resistance across the State of Wisconsin, which provides guidance at a glance of the likelihood a pathogen will respond to a particular drug.

More details: [Link]