A roundtable discussion: defining urban data science

Reference: Wei Kang, Taylor Oshan, Levi J Wolf, Geoff Boeing, Vanessa Frias-Martinez, Song Gao, Ate Poorthuis, Wenfei Xu. (2019) A roundtable discussion: defining urban data science. Environment and Planning B: Urban Analytics and City Science. 46(9), 1756-1768.  DOI: 10.1177/2399808319882826 [PDF]

Abstract:

The field of urban analytics and city science has seen significant growth and development in the past 20 years. The rise of data science, both in industry and academia, has put new pressures on urban research, but has also allowed for new analytical possibilities. Because of the rapid growth and change in the field, terminology in urban analytics can be vague and unclear. This paper, an abridged synthesis of a panel discussion among scholars in Urban Data Science held at the 2019 American Association of Geographers Conference in Washington, D.C., outlines one discussion seeking a better sense of the conceptual, terminological, social, and ethical challenges faced by researchers in this emergent field. The panel outlines the difficulties of defining what is or is not urban data science, finding that good urban data science must have an expansive role in a successful discipline of “city science.” It suggests that “data science” has value as a “signaling” term in industrial or popular science applications, but which may not necessarily be well-understood within purely academic circles. The panel also discusses the normative value of doing urban data science, linking successful practice back to urban life. Overall, this panel report contributes to the wider discussion around urban analytics and city science and about the role of data science in this domain.

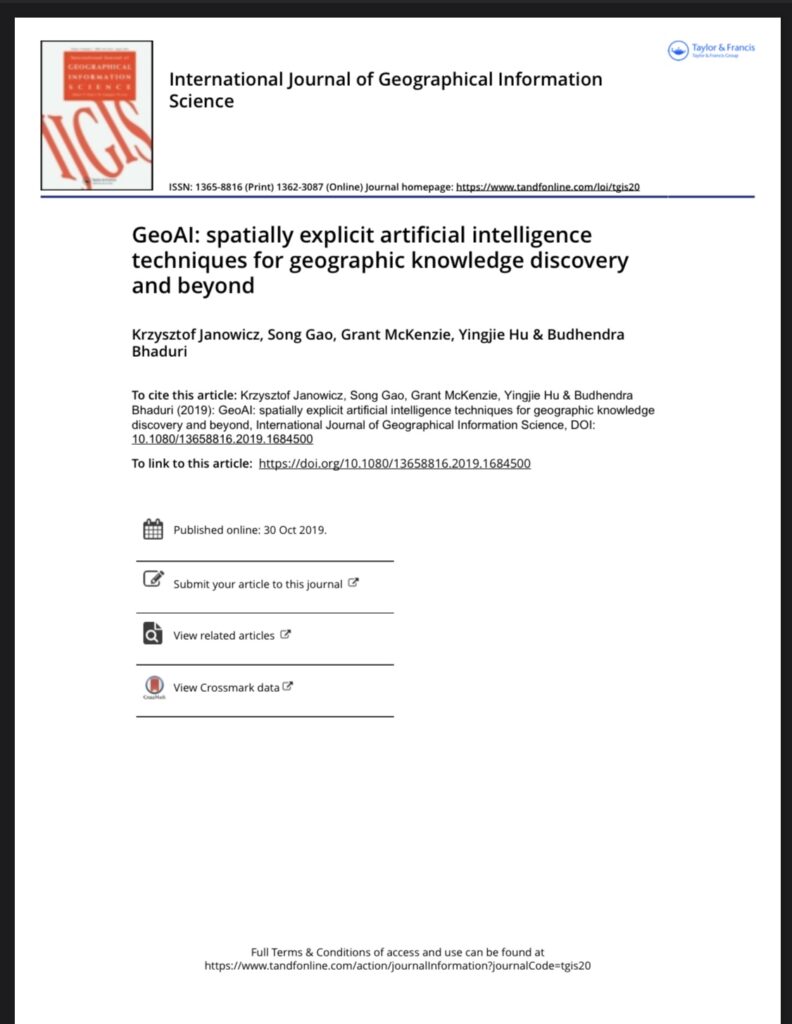
New IJGIS Editorial on GeoAI

Abstract: What is the current state-of-the-art in integrating results from artificial intelligence research into geographic information science and the earth sciences more broadly? Does GeoAI research contribute to the broader field of AI, or does it merely apply existing results? What are the historical roots of GeoAI? Are there core topics and maybe even moonshots that jointly drive this emerging community forward? In this editorial, we answer these questions by providing an overview of past and present work, explain how a change in data culture is fueling the rapid growth of GeoAI work, and point to future research directions that may serve as common measures of success.

Moonshot (Editorial): Can we develop an artificial GIS analyst that passes a domain-specific Turing Test by 2030?

Keywords: Spatial Data Science, GeoAI, Machine Learning, Knowledge Graphs, Geo-Semantics, Data Infrastructure

Acknowledgement: we sincerely thank all the reviewers who contribute their time to the peer-review process and ensure the quality of the accepted papers.

Special Issue Papers (up to date):

Janowicz, K., Gao, S., McKenzie, G., Hu, Y., and Bhaduri, B. (2020, Editorial). GeoAI: Spatially Explicit Artificial Intelligence Techniques for Geographic Knowledge Discovery and Beyond. International Journal of Geographical Information Science, 34(4), 625-636.

Acheson, E., Volpi, M., & Purves, R. S. (2020). Machine learning for cross-gazetteer matching of natural features. International Journal of Geographical Information Science, 1-27.

Duan, W., Chiang, Y., Leyk, S., Uhl, J. and Knoblock, C. (2020). Automatic alignment of contemporary vector data and georeferenced historical maps using reinforcement learning. International Journal of Geographical Information Science, forthcoming. 1-27; DOI: 10.1080/13658816.2019.1698742.

Guo, Z., & Feng, C. C. (2020). Using multi-scale and hierarchical deep convolutional features for 3D semantic classification of TLS point clouds. International Journal of Geographical Information Science, 1-20.

Law, S., Seresinhe, C. I., Shen, Y., & Gutierrez-Roig, M. (2020). Street-Frontage-Net: urban image classification using deep convolutional neural networks. International Journal of Geographical Information Science, 1-27.

Li, W., & Hsu, C. Y. (2020). Automated terrain feature identification from remote sensing imagery: a deep learning approach. International Journal of Geographical Information Science, 1-24.

Ren, Y., Chen, H., Han, Y., Cheng, T., Zhang, Y., & Chen, G. (2020). A hybrid integrated deep learning model for the prediction of citywide spatio-temporal flow volumes. International Journal of Geographical Information Science, 1-22.

Sparks, K., Thakur, G., Pasarkar, A., & Urban, M. (2020). A global analysis of cities’ geosocial temporal signatures for points of interest hours of operation. International Journal of Geographical Information Science, 1-18.

Xie, Y., Cai, J., Bhojwani, R., Shekhar, S., & Knight, J. (2020). A locally-constrained YOLO framework for detecting small and densely-distributed building footprints. International Journal of Geographical Information Science, 1-25.

Zhu, D., Cheng, X., Zhang, F., Yao, X., Gao, Y., & Liu, Y. (2020). Spatial interpolation using conditional generative adversarial neural networks. International Journal of Geographical Information Science, 1-24.

Dr. Clio Andris Visited UW-Madison Geography

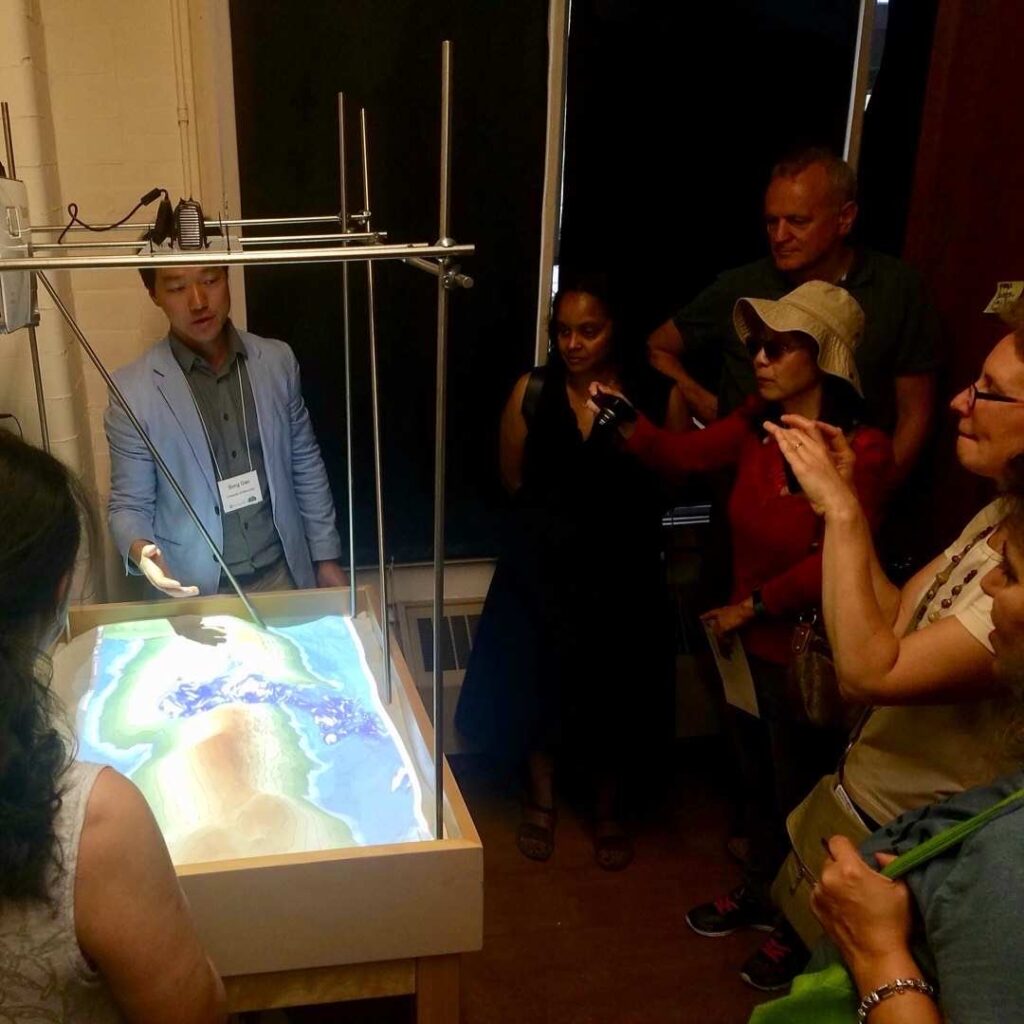
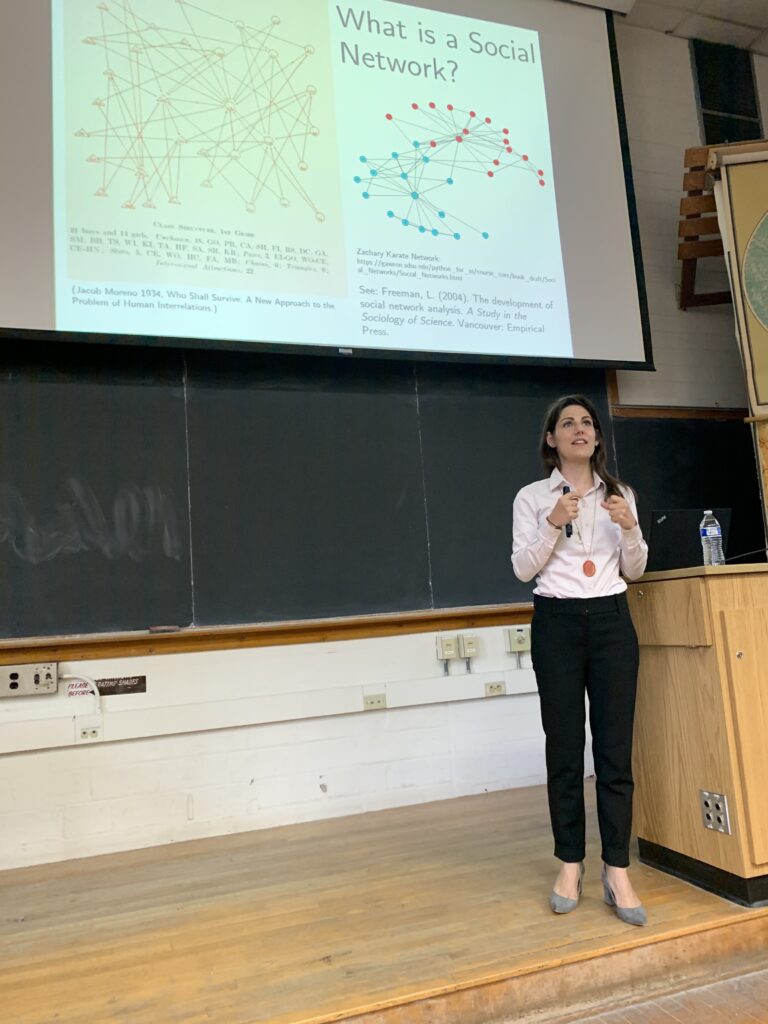
Dr. Clio Andris (Assistant Professor of City & Regional Planning and Interactive Computing) from Georgia Tech was invited to the renowned Yi-Fu Lecture at UW-Madison Geography. Our GeoDS Lab was honored to host Dr. Andris’ visit and had a great conversation on collaborative projects and joint research.

Dr. Andris is giving her talk on spatial social network analysis.
Grads Brown-Bag Talk
UW-Madison’s own made ice cream

Prof. Song Gao received a new NSF Research Grant

Recently, Dr. Song Gao (Co-PI) received a NSF grant together with Dr. Qunying Huang (PI), Dr. Daniel Wright (Co-PI), Dr. Nick Fang (Co-PI), and Dr. Yi Qiang (Co-PI).

Title: A GeoAI Data-Fusion Framework for Real-Time Assessment of Flood Damage and Transportation Resilience by Integrating Complex Sensor Datasets

Abstract: Traditional modeling approaches for flood damage assessment are often labor-intensive and time-consuming due to requirements for domain expertise, training data, and field surveys. Additionally, the lack of data and standard methodologies makes it more challenging to assess transportation network resilience in real-time during flood disasters. To address these challenges, this project aims to integrate novel data streams from both physical sensor networks (e.g., remotely-sensed data using unmanned aerial vehicles [UAVs]), and citizen sensor networks (e.g., crowdsourced traffic data, social media and community responsive teams connected through a developed mobile app). The goal is to develop a framework for real-time assessment of damage and the resilience of urban transportation infrastructures after coastal floods via the state-of-the-art computer vision, deep learning and data fusion technologies. The project will also advance Data Science through multi-disciplinary and multi-institutional collaborations. The project is expected to improve the sustainability, resilience, livability, and general well-being of coastal communities by having a direct impact on the effectiveness, capability, and potential of using both physical and social sensor data. This will in turn enable and transform damage assessments, and identify critical and vulnerable components in transportation networks in a more effective and efficient manner. The interdisciplinary research team, along with students and collaborators from different coastal regions, will facilitate the sharing of knowledge and technologies from different socio-environmental contexts and testing the transferability of the research outcomes.

The project will harmonize physical and citizen sensors within a geospatial artificial intelligence (GeoAI) data-fusion framework with a focus on three research thrusts: (1) unsupervised flood extent detection by integrating UAV images collected throughout this project with existing geospatial data (e.g., road networks and building footprints); (2) flood depth estimation using deep learning and computer vision techniques combined with crowdsourced photos and UAV imagery; and (3) assessment of the impact on and resilience of transportation networks based on near real-time flood and damage information. The innovative methodology will be demonstrated and deployed through collaborative efforts in response to future flood events as well as several historical storms. The project will produce open-source algorithms for future educational use, raw and processed datasets and associated processing software, a mobile app to engage community responsive science teams, and three research publications.
Source: https://www.nsf.gov/awardsearch/showAward?AWD_ID=1940091

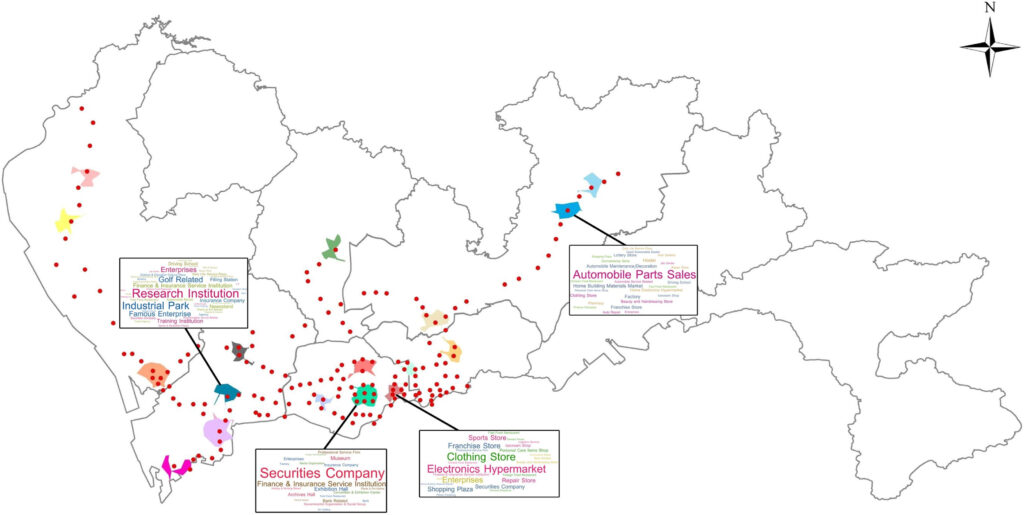
The fusion of knowledge-driven and data-driven approaches to discovering urban functional regions

Papadakis, E., Gao, S., & Baryannis, G. (2019). Combining Design Patterns and Topic Modeling to Discover Regions Supporting Particular Functionality. ISPRS International Journal of Geo-Information. 8(9), 385; https://doi.org/10.3390/ijgi8090385.
Abstract

The problem of discovering regions that support particular functionalities in an urban setting has been approached in literature using two general methodologies: top-down, encoding expert knowledge on urban planning and design and discovering regions that conform to that knowledge; and bottom-up, using data to train machine learning models, which can discover similar regions. Both methodologies face limitations, with knowledge-based approaches being criticized for scalability and transferability issues and data-driven approaches for lacking interpretability and depending heavily on data quality.

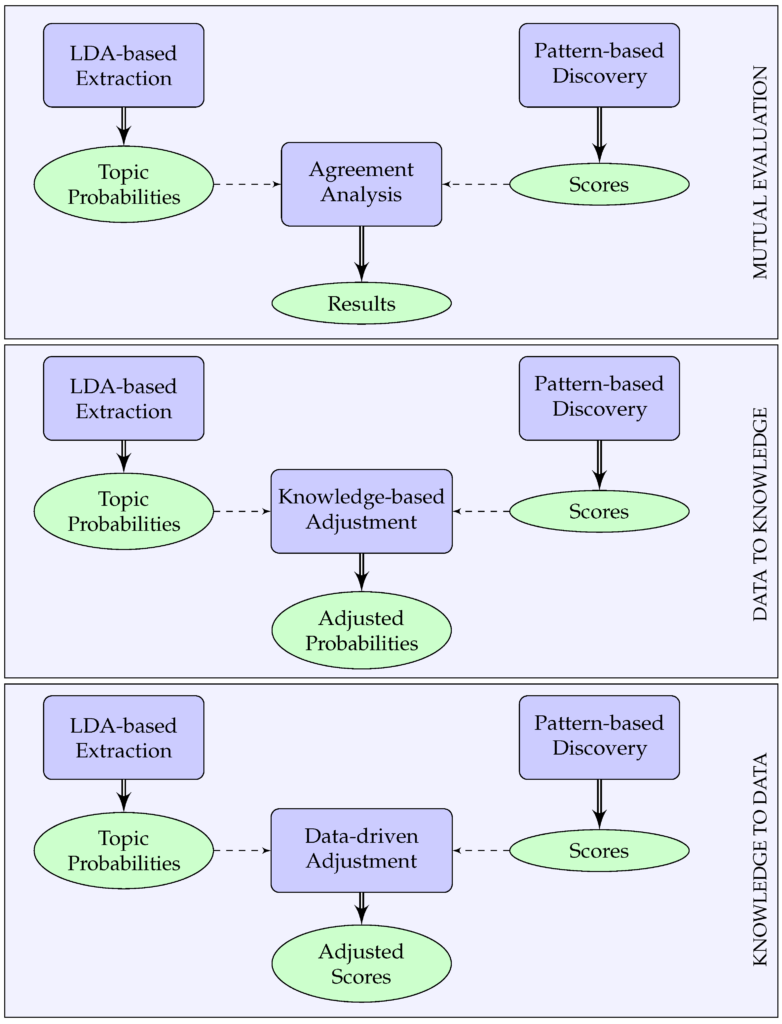
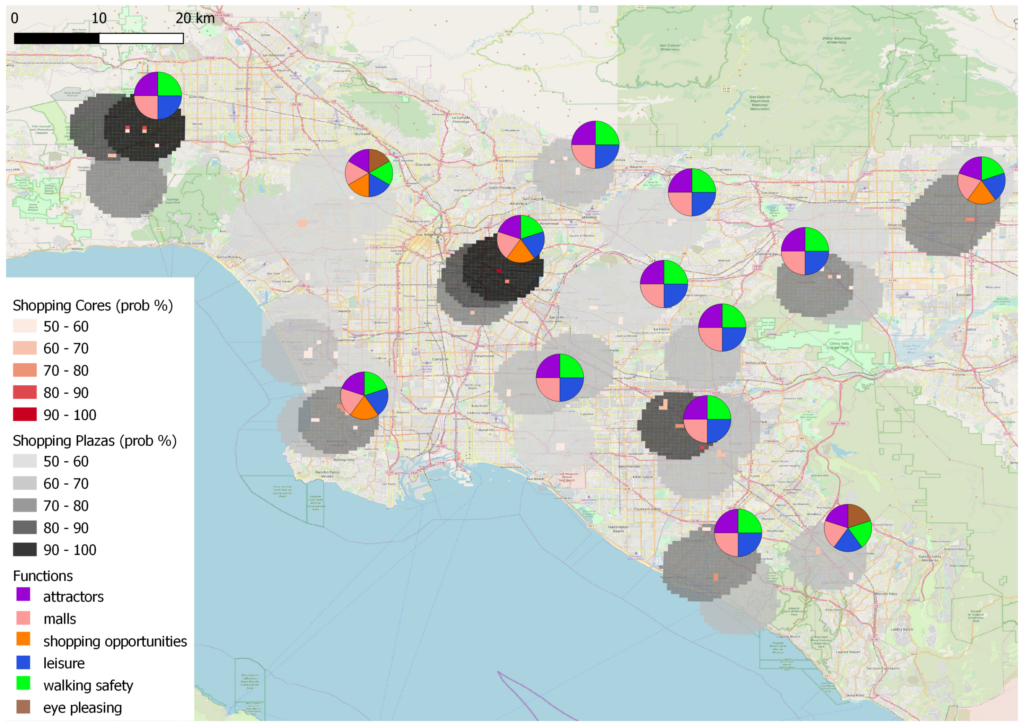
To mitigate these disadvantages, we propose a novel framework that fuses a knowledge-based approach using design patterns and a data-driven approach using latent Dirichlet allocation (LDA) topic modeling in three different ways: Functional regions discovered using either approach are evaluated against each other to identify cases of significant agreement or disagreement; knowledge from patterns is used to adjust topic probabilities in the learning model; and topic probabilities are used to adjust pattern-based results. The proposed methodologies are demonstrated through the use case of identifying shopping-related regions in the Los Angeles metropolitan area. Results show that the combination of pattern-based discovery and topic modeling extraction helps uncover discrepancies between the two approaches and smooth inaccuracies caused by the limitations of each approach.

Figure. The proposed framework of fusing knowledge-based and data-driven approaches
Figure. Extracted shopping regions by combining data-to-knowledge and knowledge-to-data approaches.

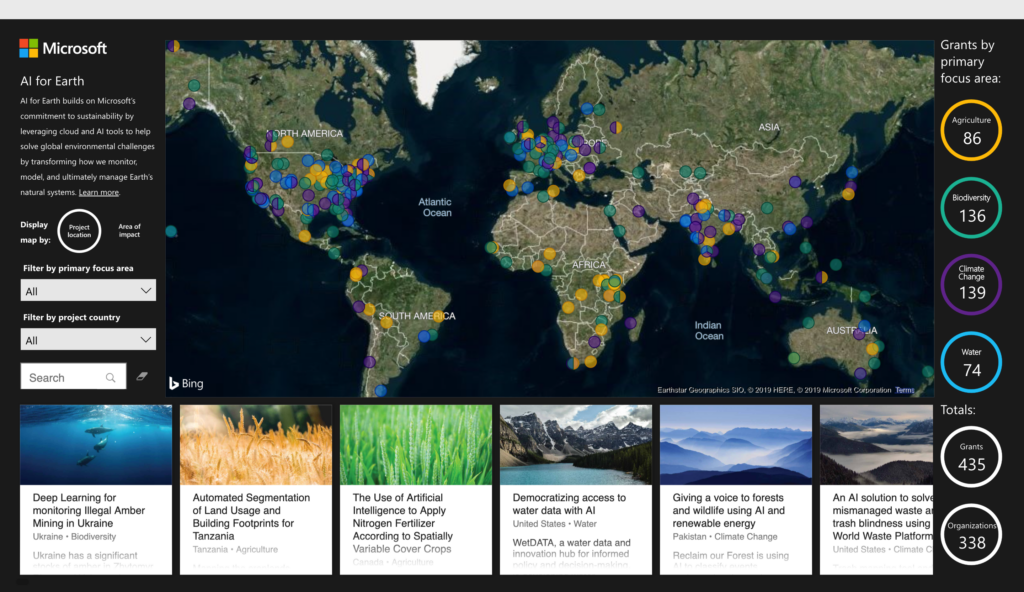
Prof. Song Gao received an AI for Earth Grant from Microsoft

[Madison, WI/USA] – [August 8, 2019] – Professor Song Gao as the Principal Investigator (PI) has been awarded an AI for Earth research grant from Microsoft to help further the efforts in the area of Geospatial Artificial Intelligence (GeoAI).

This new grant will provide Dr. Song Gao and his research assistants Yuhao Kang and Jake Kruse at the GeoDS@UW-Madison lab, and Dr. Fan Zhang (Postdoc Researcher at the MIT Senseable city Lab and Peking University) with the Azure cloud computing resources and AI data labelling services to accelerate their work on understanding the playability of cities and metropolitan areas from the human-environment interaction perspective using multi-source geospatial big data (e.g., images, texts, and videos).

The Microsoft AI for Earth is a $50 million, 5-year program that brings the full advantage of Microsoft technology to those working to solve global environmental challenges in the key focus areas of climate, agriculture, water and biodiversity. Through grants that provide access to cloud and AI tools, opportunities for education and training on AI, and investments in innovative, scalable solutions, AI for Earth works to advance sustainability across the globe. 

Learn more about the Microsoft AI for Earth program: https://www.microsoft.com/en-us/aiforearth 

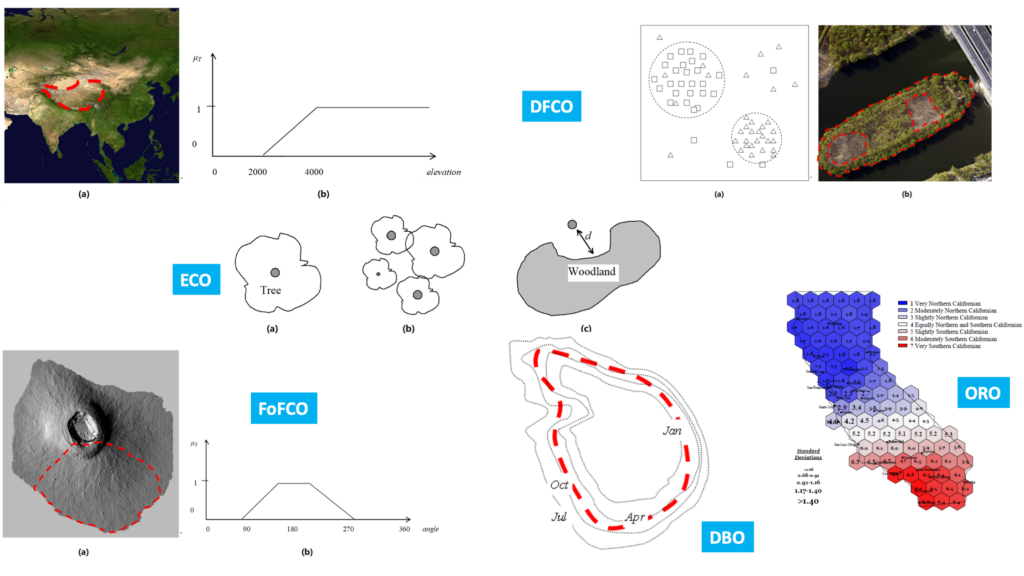
A theoretical framework of modeling vague areal objects in GIScience

Liu, Y., Yuan, Y., & Gao, S. (2019). Modeling the Vagueness of Areal Geographic Objects: A Categorization SystemISPRS International Journal of Geo-Information8(7), 306. DOI: https://doi.org/10.3390/ijgi8070306

Abstract: Modeling vague objects with indeterminate boundaries has drawn much attention in geographic information science (GIScience). Because fields and objects are two perspectives in modeling geographic phenomena, this paper investigates the characteristics of vague regions from the perspective of the field/object dichotomy. Based on the assumption that a vague object can be viewed as the conceptualization of a field, we defined five categories of vague objects: (1) direct field-cutting objects, (2) focal operation-based field-cutting objects, (3) element-clustering objects, (4) object-referenced objects, and (5) dynamic boundary objects. We then established a categorization system to formalize the semantic differences between vague objects using the fuzzy set theory. The proposed framework provides valuable input for the conceptualization, interpretation, and modeling of vague geographical objects.

Figure. The categorization system of the five categories of fuzzy regions and their relations.

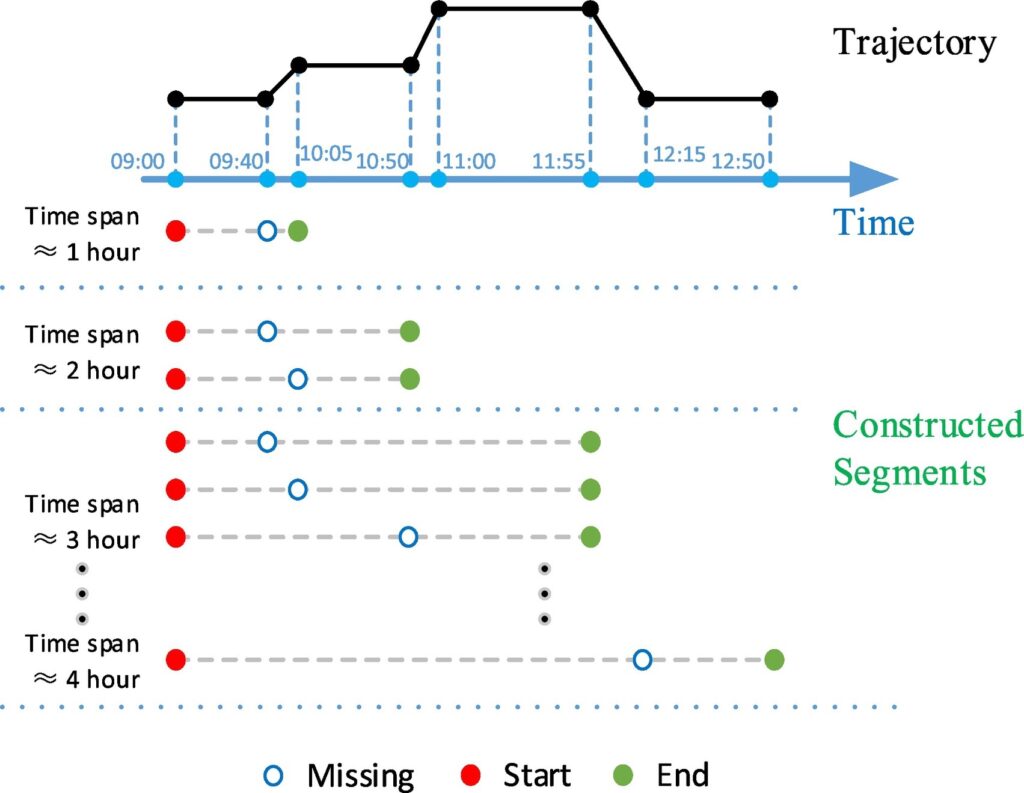
Full Paper about “Trajectory Reconstruction” accepted at Computers, Environment and Urban Systems

Citation info: Mingxiao Li, Song Gao, Feng Lu, Hengcai Zhang. (2019) Reconstruction of human movement trajectories from large-scale low-frequency mobile phone data. Computers, Environment and Urban Systems, Volume 77, September 2019, 101346. DOI: 
10.1016/j.compenvurbsys.2019.101346

Abstract

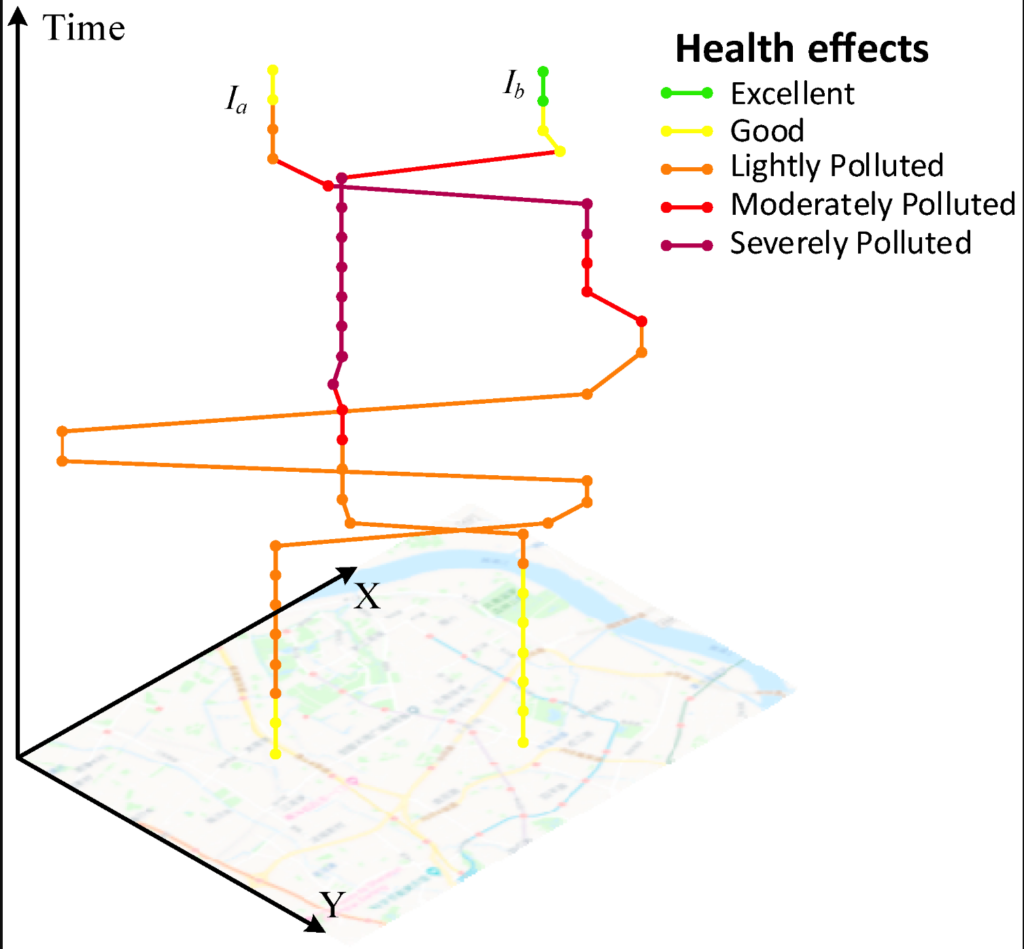
Understanding human mobility is important in many fields, such as geography, urban planning, transportation, and sociology. Due to the wide spatiotemporal coverage and low operational cost, mobile phone data have been recognized as a major resource for human mobility research. However, due to conflicts between the data sparsity problem of mobile phone data and the requirement of fine-scale solutions, trajectory reconstruction is of considerable importance. Although there have been initial studies on this problem, existing methods rarely consider the effect of similarities among individuals and the spatiotemporal patterns of missing data. To address this issue, we propose a multi-criteria data partitioning trajectory reconstruction (MDP-TR) method for large-scale mobile phone data. In the proposed method, a multi-criteria data partitioning (MDP) technique is used to measure the similarity among individuals in near real-time and investigate the spatiotemporal patterns of missing data. With this technique, the trajectory reconstruction from mobile phone data is then conducted using classic machine learning models. We verified the method using a real mobile phone dataset including 1 million individuals with over 15 million trajectories in a large city. Results indicate that the MDP-TR method outperforms competing methods in both accuracy and robustness. We argue that the MDP-TR method can be effectively utilized for grasping highly dynamic human movement status and improving the spatiotemporal resolution of human mobility research.

Full Paper about “Map Style Transfer” accepted at the International Journal of Cartography

Our paper entitled Transferring Multiscale Map Styles Using Generative Adversarial Networks has been accepted for publishing in the International Journal of Cartography.

DOI: 10.1080/23729333.2019.1615729

Authorship: Yuhao KangSong GaoRobert E. Roth.

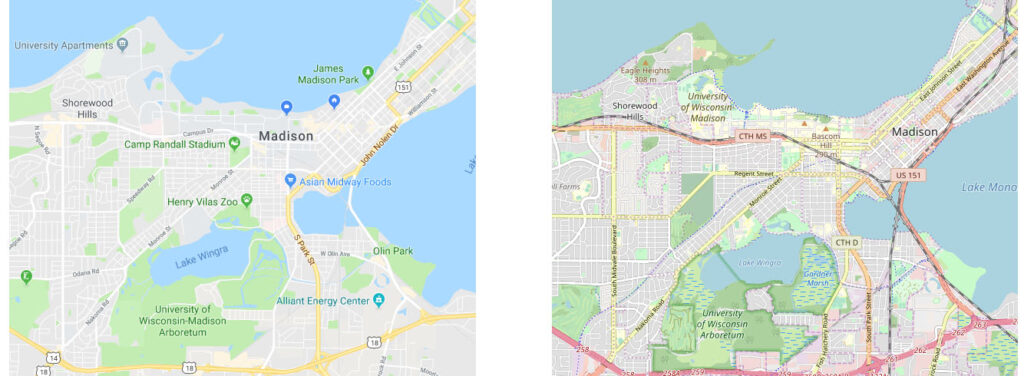
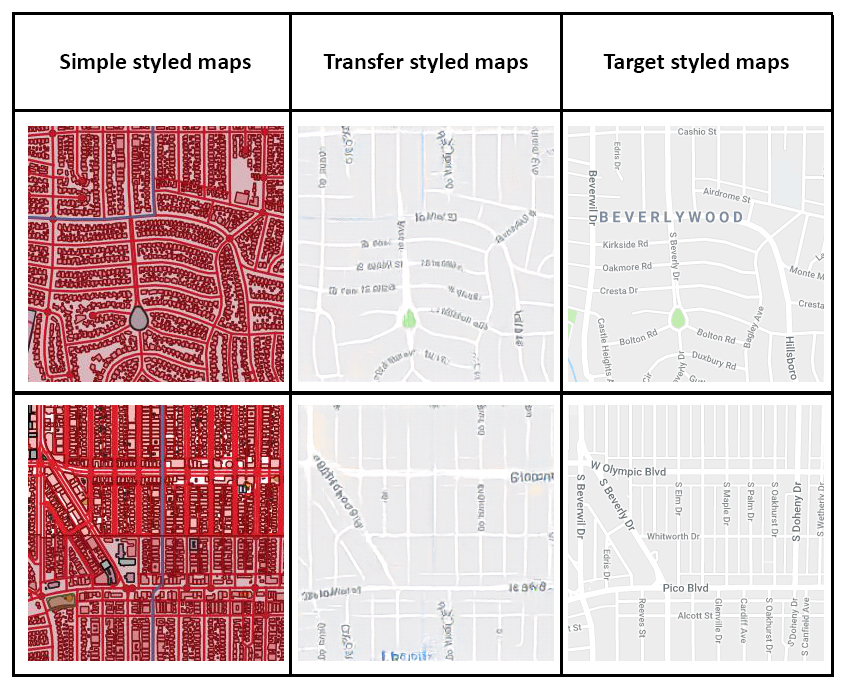
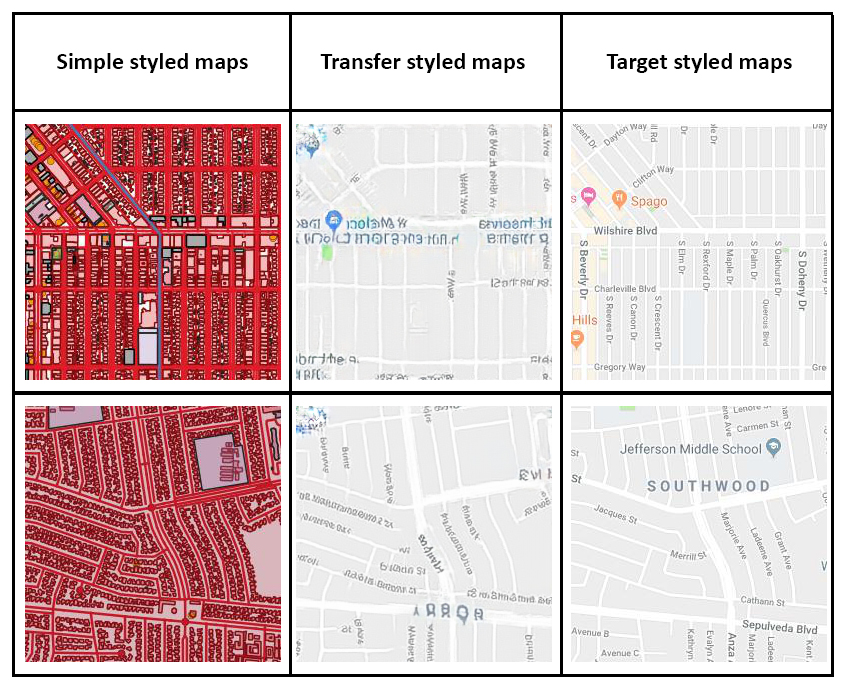
This paper proposes a methodology framework to transfer the cartographic style in different kinds of maps. By inputting the raw GIS vector data, the system can automatically render styles to the input data with target map styles but without CartoCSS or Mapbox GL style specification sheets. The Generative Adversarial Networks (GANs) are used in this research. The study explores the potential of implementing artificial intelligence in cartography in the era of GeoAI.

We outline several important directions for the use of AI in cartography moving forward. First, our use of GANs can be extended to other mapping contexts to help cartographers deconstruct the most salient stylistic elements that constitute the unique look and feel of existing designs, using this information to improve design in future iterations. This research also can help nonexperts who lack professional cartographic knowledge and experience to generate reasonable cartographic style sheet templates based on inspiration maps or visual art. Finally, integration of AI with cartographic design may automate part of the generalization process, a particularly promising avenue given the difficult of updating high resolution datasets and rendering new tilesets to support the ’map of everywhere’.

Here is the abstract:

The advancement of the Artificial Intelligence (AI) technologies makes it possible to learn stylistic design criteria from existing maps or other visual arts and transfer these styles to make new digital maps. In this paper, we propose a novel framework using AI for map style transfer applicable across multiple map scales. Specifically, we identify and transfer the stylistic elements from a target group of visual examples, including Google Maps, OpenStreetMap, and artistic paintings, to unstylized GIS vector data through two generative adversarial network (GAN) models. We then train a binary classifier based on a deep convolutional neural network to evaluate whether the transfer styled map images preserve the original map design characteristics. Our experiment results show that GANs have a great potential for multiscale map style transferring, but many challenges remain requiring future research.

Examples of Map Style Transfer using Pix2Pix
Examples of Map Style Transfer using CycleGAN

You can also visit the following links to see some of the trained results:

CycleGAN at zoom level 15: https://geods.geography.wisc.edu/style_transfer/cyclegan15/

CycleGAN at zoom level 18: https://geods.geography.wisc.edu/style_transfer/cyclegan18/

Pix2Pix at zoom level 15: https://geods.geography.wisc.edu/style_transfer/pix2pix15/

Pix2Pix at zoom level 18: https://geods.geography.wisc.edu/style_transfer/pix2pix18/

Dataset available (Only simple styled maps are available, while target styled maps are not available because of the copyright from Google):

Level 15: Training, Test.

Level 18: Training, Test.

Full Paper about “Solar Energy Estimation using Street-view Images” accepted at the Journal of Cleaner Production

Our paper entitled Towards feasibility of photovoltaic road for urban traffic-solar energy estimation using street view image has been accepted for publishing in the Journal of Cleaner Production.
Authorship: Ziyu Liu, Anqi Yang, Mengyao Gao, Hong Jiang, Yuhao Kang, Fan Zhang, Teng Fei.

This paper proposes a methodology framework to calculate the solar energy that can be collected by solar panels paved on the road. Estimation of how much energy can be collected help making decision of where these photovoltaic road system should be built. Exemplified by the city of Boston, using street view images and taking light obstacles, traffic conditions, weather conditions and seasonal changes of solar radiation into consideration, the potential of solar energy generated by Boston’s road network is estimated precisely. Our results show that the energy obtained from urban road network can support all private cars in Boston.
Here is the abstract:
A sustainable city relies on renewable energy, which promotes the development of electric vehicles. To support electric vehicles, the concept of charging vehicles while driving has been put forward. Under such circumstances, constructing solar panels on urban roads is an innovative option with great benefits, and the accurate calculation of road photovoltaic power generation is a prerequisite. In this paper, we propose a novel framework for predicting and calculating the solar radiation and electric energy that can be collected from the roads. Google Street View images are collected to measure the sky obstruction of roads which is integrated with the solar radiation model to estimate the irradiation receiving capability. In addition to sky obstruction, we also take the impact of traffic conditions and weather situations into consideration in the calculation. Radiation maps at different times in a year are produced from our work to analyze the roads photovoltaic distribution. In order to test the feasibility of our framework, we take Boston as a case study. Results show that roads in Boston can generate abundant electricity for all future electric vehicles in the city. What’s more, main roads through Boston exhibit better power generation potential, and the effect of the traffic condition is limited. Our calculation framework confirms that utilizing solar panels as road surfaces is a great supplement of city power with the unique ability to charge moving cars.

Solar radiation along streets at Boston

Funded Project: Geo-mapping antimicrobial resistance in E. coli from humans & animals in Wisconsin

Recently, Dr. Laurel Legenza (PI) from the UW School of Pharmacy, Dr. Thomas R. Fritsche (Co-PI) from the Marshfield Medical Center and Professor Song Gao participating as a geospatial analysis scientist along with the State Cartographer’s Office (SCO) and other multidisciplinary collaborators, have been awarded a pilot grant from the UW Institute for Clinical and Translational Research (ICTR) and the Marshfield Clinic Research Institute for a research proposal titled “Geo-mapping antimicrobial resistance in E. coli from humans & animals” in Wisconsin.

The AMR Tracker tool, shown in the screenshot above, provides a map showing an array of antibiotics that might be prescribed to treat an infection (in this case, E.coli), and which one can be expected to work best in a specific geographic location. This could help doctors choose the right drug for their patients.

When a patient arrives at a hospital with an infection, his/her doctor must decide which antibiotic might have the best chance of curing him/her — no easy feat when disease-causing pathogens are increasingly resistant to multiple antibiotics. To make this data more accessible, a team of researchers at the University of Wisconsin–Madison School of Pharmacy and the State Cartographer’s Office have developed a prototype system that maps out trends in antibiotic resistance across the State of Wisconsin, which provides guidance at a glance of the likelihood a pathogen will respond to a particular drug.

More details: [Link]

Full Paper about “Human Emotions at Places” accepted at Transactions in GIS

Our full paper entitled Extracting human emotions at different places based on facial expressions and spatial clustering analysis” has been accepted for publishing in the journal of Transactions in GIS, which is also part of the special issue on GIScience Research Sessions for the 2019 Esri User Conference.

Authorship: Yuhao Kang, Qingyuan Jia, Song Gao, Xiaohuan Zeng, Yueyao Wang, Stephan Angsuesser, Yu Liu, Xinyue Ye, Teng Fei.

This paper proposes a methodology framework to measure human emotions at places with advanced artificial intelligence technologies and explore the relationship between human emotions and environmental factors. And a ranking list of tourist attractions around the world is created based on human happiness measured using over 2 million facial expressions.

Human happiness scores at world tourist attractions.

Related to this work, Yuhao Kang won the first place in the 2019 AAG Robert Raskin Student best paper competition. Link: http://gis.cas.sc.edu/cisg/?page_id=126

Here is the abstract: The emergence of big data enables us to evaluate the various human emotions at places from a statistic perspective by applying affective computing. In this study, a novel framework for extracting human emotions from large-scale georeferenced photos at different places is proposed. After the construction of places based on spatial clustering of user generated footprints collected in social media websites, online cognitive services are utilized to extract human emotions from facial expressions using state-of-the-art computer vision techniques. And two happiness metrics are defined for measuring the human emotions at different places. To validate the feasibility of the framework, we take 80 tourist attractions around the world as an example and a happiness ranking list of places is generated based on human emotions calculated over 2 million faces detected out from over 6 million photos. Different kinds of geographical contexts are taken into consideration to find out the relationship between human emotions and environmental factors. Results show that much of the emotional variation at different places can be explained by a few factors such as openness. The research may offer insights on integrating human emotions to enrich the understanding of sense of place in geography and in place-based GIS.

Tourist attraction ranking based on the average happiness index using facial expressions.

Prof. Michael F. Goodchild visited UW-Madison

Recently, Prof. Mike Goodchild was invited to visit our lab and the Department of Geography at the University of Wisconsin-Madison. Prof. Goodchild is the Emeritus Professor of Geography at the University of California, Santa Barbara. He was elected member of the National Academy of Sciences and the American Academy of Arts and Sciences, etc. He gave a talk titled “Geography and GIScience: An Evolving Relationship” in the department Yi-Fu Tuan Lecture series on Friday, April 19th, shared his view of how GIScience and Geography evolved together during the past decades.

The GeoDS lab also invited Prof. Goodchild to join our research group meeting. Four lab members presented their recent works and received insightful suggestions and comments from Prof. Goodchild.

Timothy Prestby Received the HILLDALE FELLOW Award

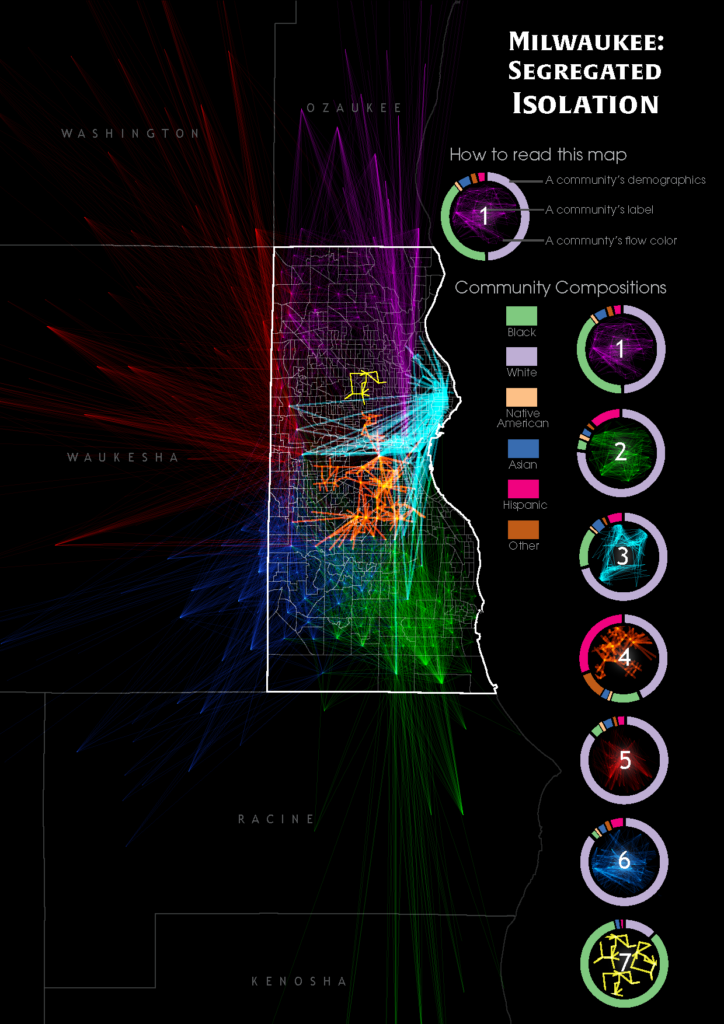
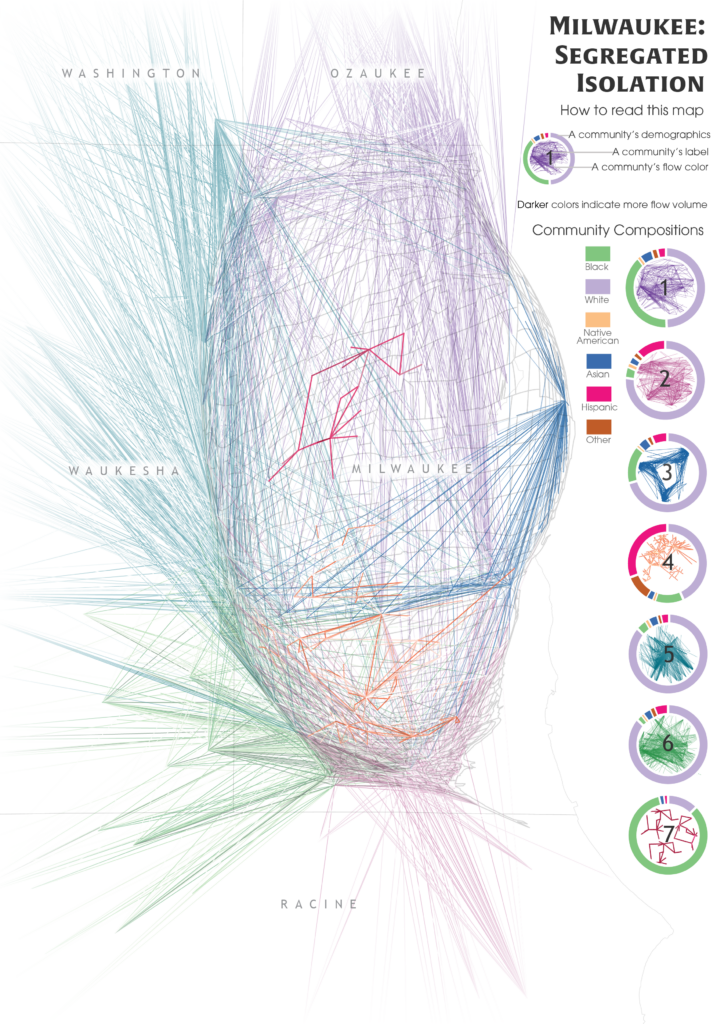
Please join us congratulating our junior student Timothy Prestby, who is currently an undergraduate research assistant in the GeoDS Lab under Prof. Song Gao’s mentorship, just got the university “Hilldale Undergraduate/Faculty Research Fellowships” and was awarded  in the 2019 Chancellor’s Undergraduate Awards Ceremony! 

The awarded research project title is: Understanding Neighborhood Isolation through Big-Data Human Mobility Analytics”. 

Previous Hilldale Fellows at the University of Wisconsin-Madison:

https://awards.advising.wisc.edu/campus-wide-award-recipients/test-hilldale-fellows/

GeoDS Lab at the 2019 AAG Annual Meeting

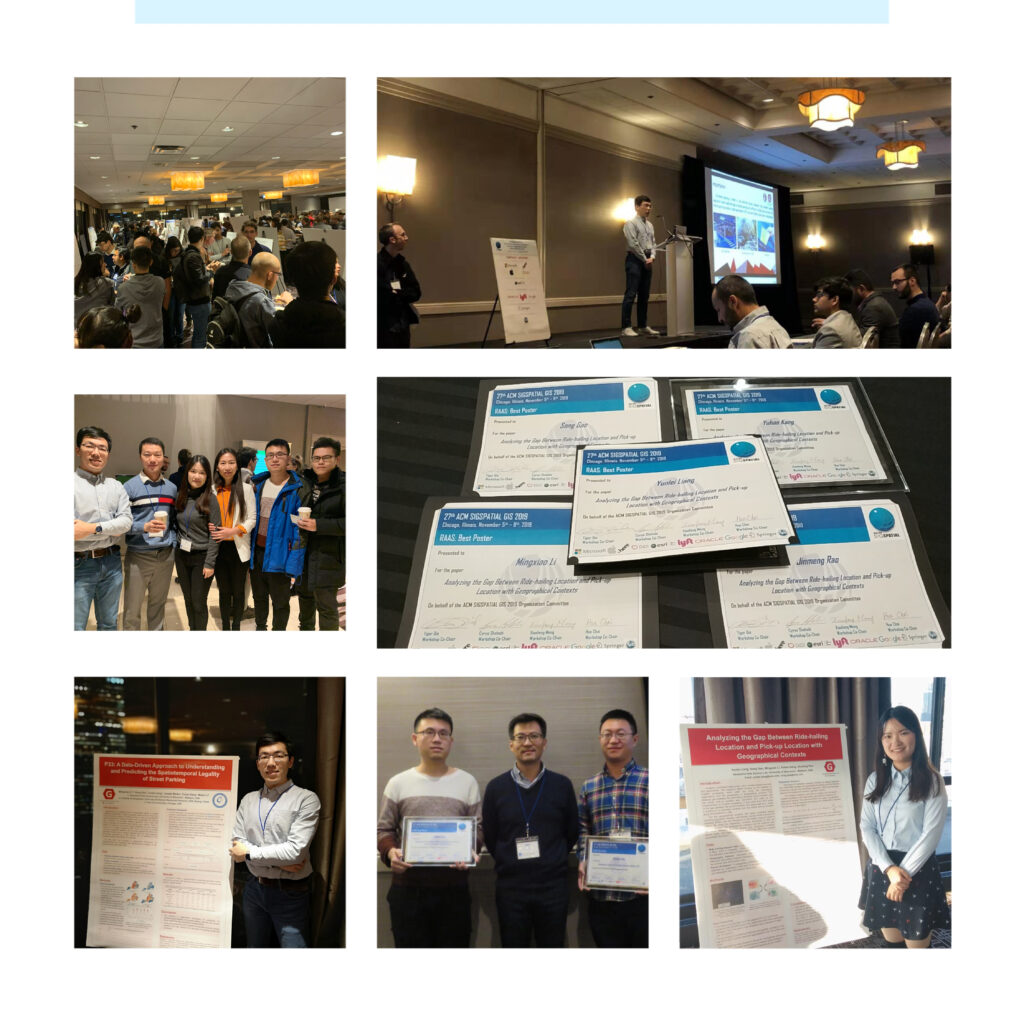
During the last week (April 3-7), six GeoDS lab members have actively participated in the 2019 AAG Annual meeting and successfully presented their work. Especially congratulations to Yuhao Kang who won the first place in the Robert Raskin Student best paper competition!

Yuhao Kang presented his work titled “Human Emotions at Different Places: A Ranking of Happiest Tourist Attractions around the World Based on Facial Expressions and Spatial Clustering Analysis” in the Cyberinfrastructure Specialty Group Student paper competition Session. [Abstract]. Robert Raskin Student Competition 2019: http://gis.cas.sc.edu/cisg/?page_id=126

Yunlei Liang presented her work titled “Optimizing Bus Stop Spacing Using a Spatial Interaction Coverage Model and the Maximal Covering Location Problem Model” in the Spatial Analysis and Modeling Specialty Group Student paper competition Session. [Abstract]

Mingxiao Li presented his work titled “Reconstruction of human movement trajectories from large-scale low-frequency mobile phone data” in the GeoAI and Deep Learning Symposium. [Abstract]

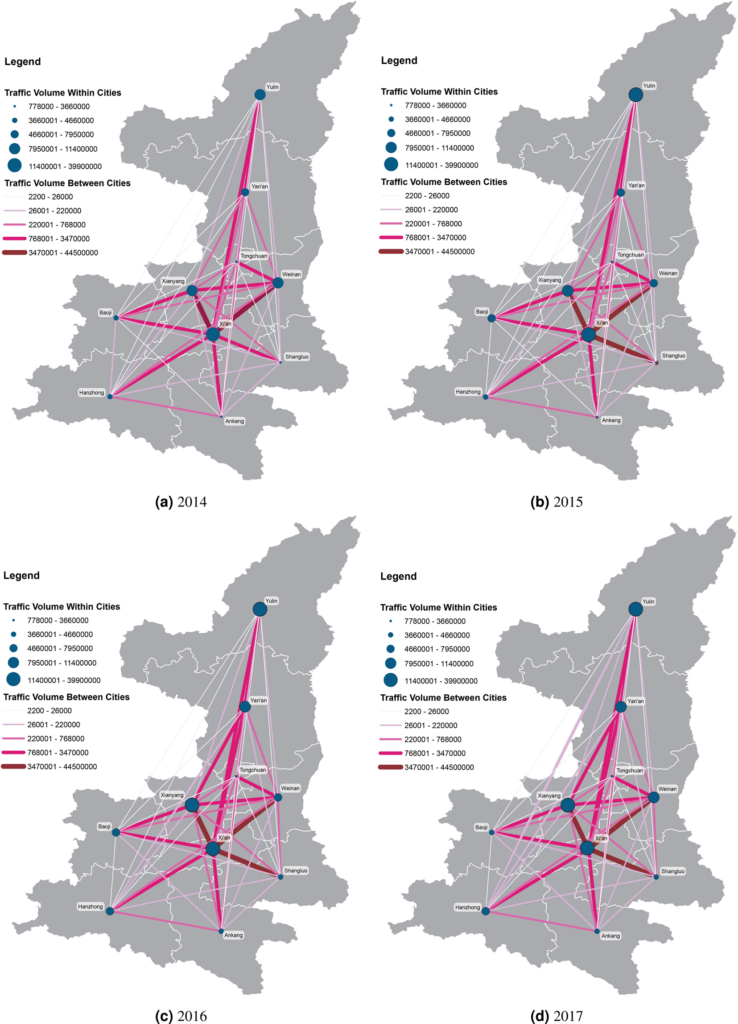
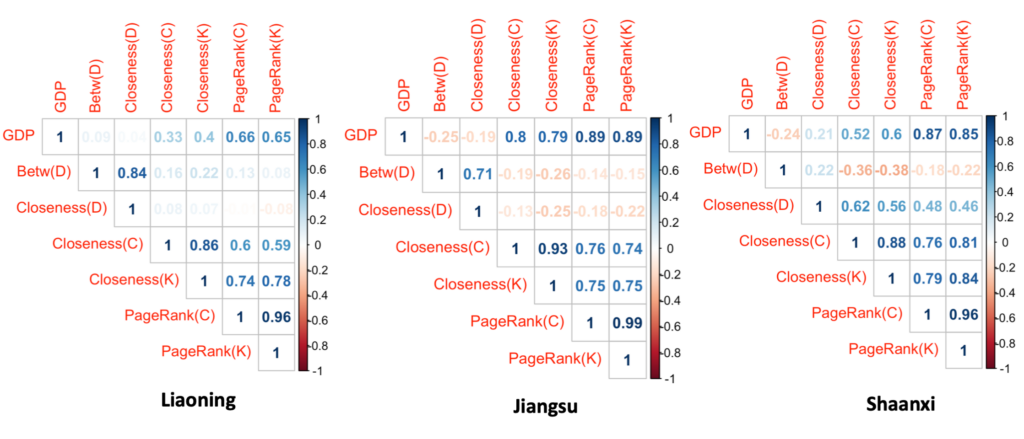
Yuqi Gao presented her work named “Analyzing Regional Economic Indicators from Transportation Network Analytics” in the Automated GISci for Network-based Decisions Session. [Abstract]

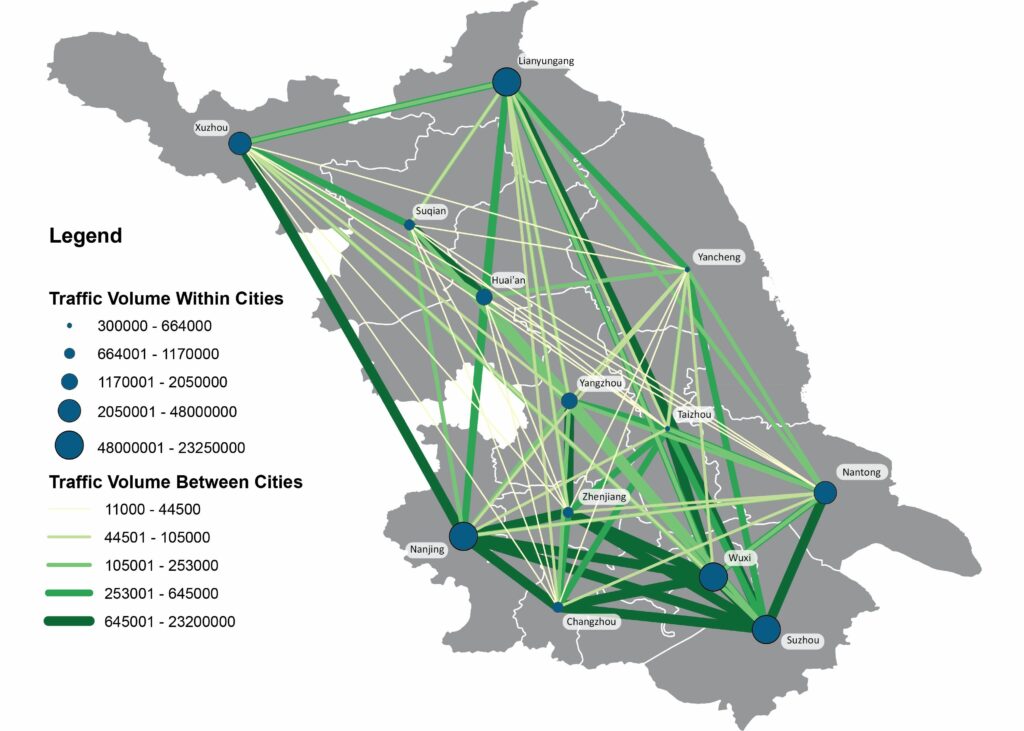
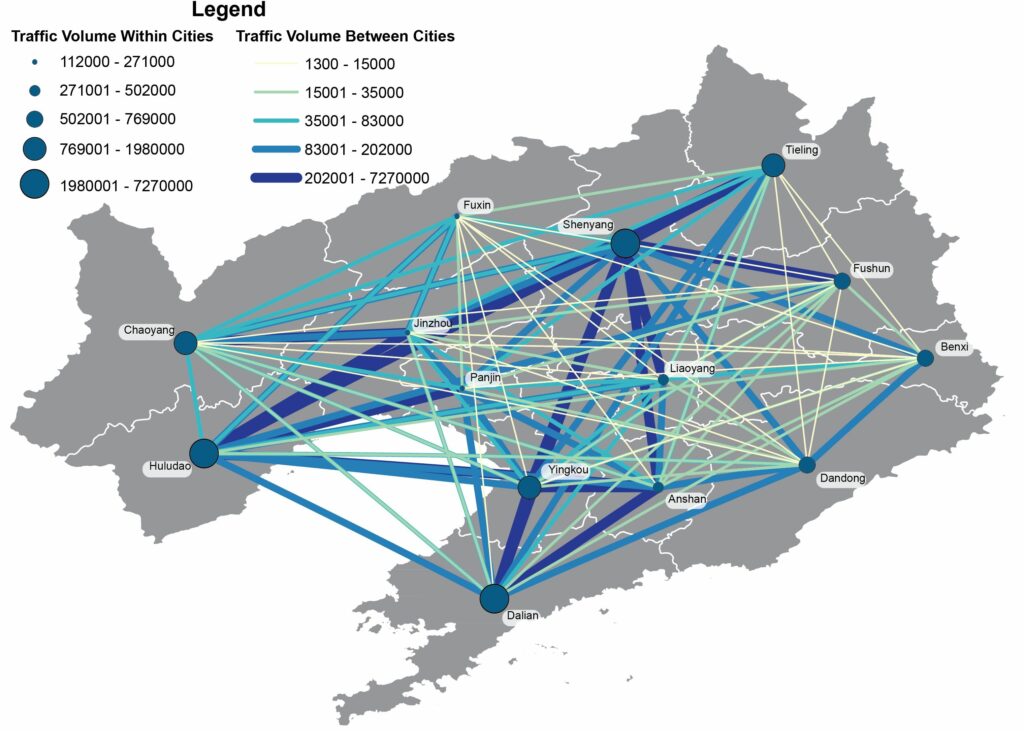
Timothy Prestby presented his work titled “Linking Traffic Volume to Economic Development Index Using Big Data and Gravity Models” in the Urban Geography Poster Session. [Poster]

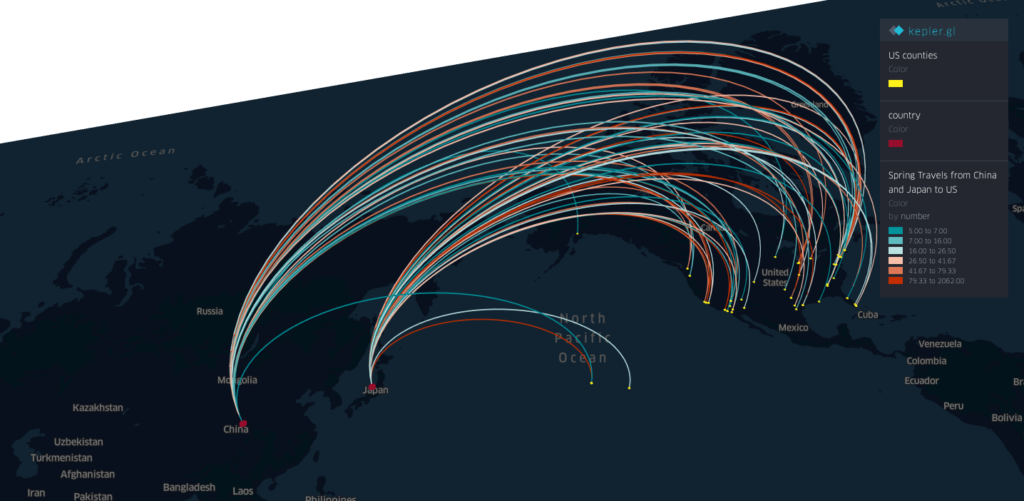
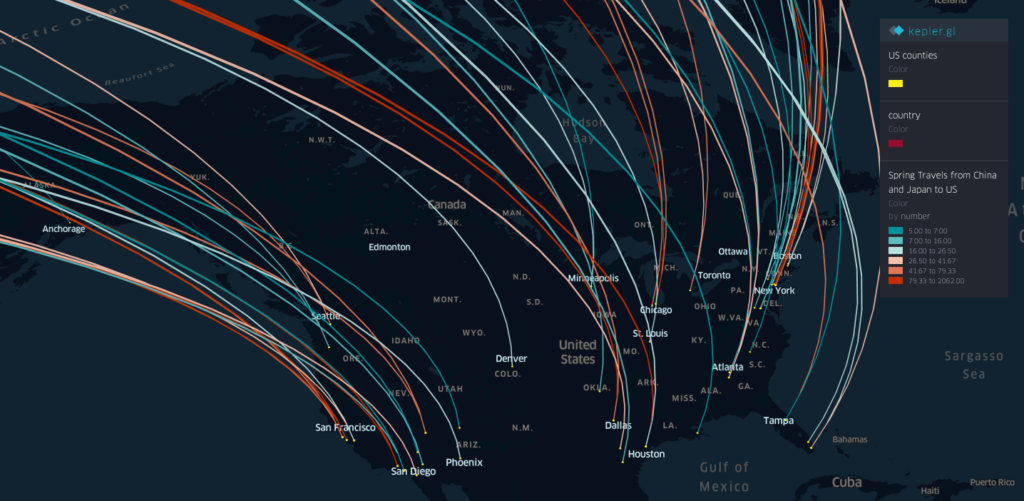
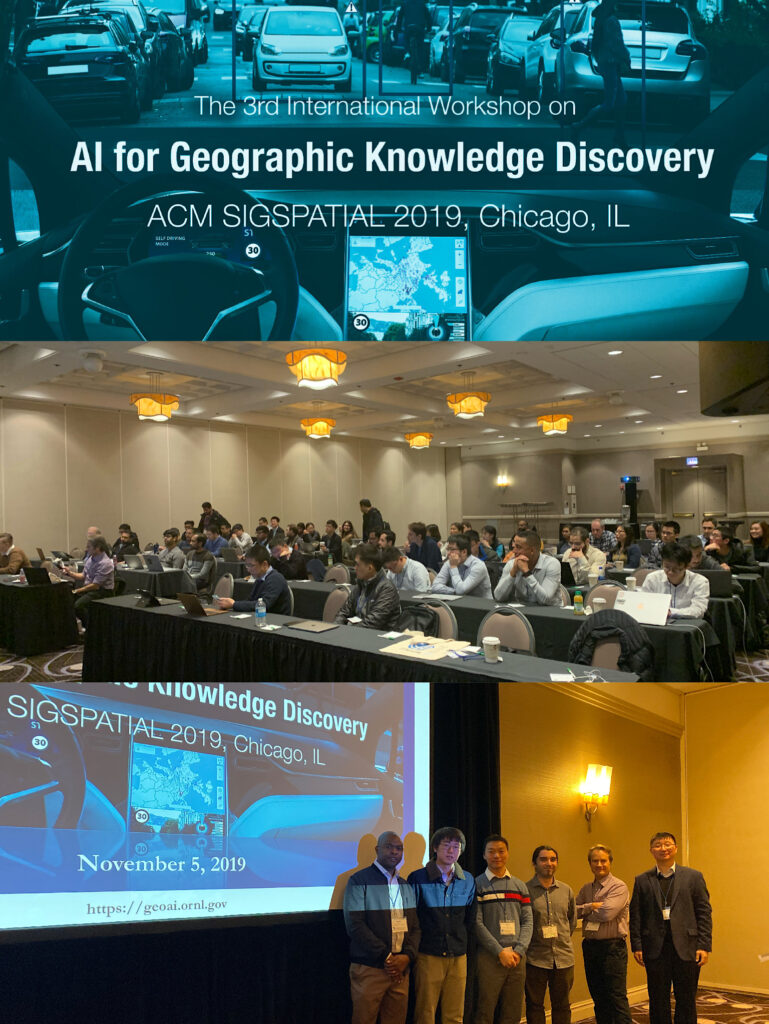
Professor Song Gao co-organized The 2nd AAG Symposium on GeoAI and Deep Learning for Geospatial Research and was invited to the panel discussions of “Urban Data Science”.

Congrats to all of them! Go Badgers!

Group Photo

Professor Gao was appointed as the Associated Editor of Annals of GIS

Professor Song Gao was invited and appointed as the Associated Editor for the CPGIS flagship journal: Annals of GIS  published by Taylor & Francis.

Annals of GIS is an international peer-reviewed journal that encourages the interdisciplinary exchange of original ideas on theory, methods, development and applications in the fields of geo-information science. Research papers are invited to cover the latest development in the following areas:

  • remote sensing and data acquisition
  • geographic information systems
  • geo-visualization and virtual geographic environments (VGE)
  • spatial analysis and modeling
  • uncertainty modeling

and their applications in natural resource, ecosystem, urban management, and other humanities and social science areas.

GeoJSON Conversion Issue

Some students asked me the question about the difference between Esri standard and the open standard in my course: Geospatial Big Data Analytics. The current ArcGIS conversion tool (in ArcMap not ArcGIS Pro) “JSON To Features” only supports its own format (aka Esri GeoJSON) and the structure is below: 

And it is different from the open standard GeoJSON  format from the Internet Engineering Task Force (IETF) working grouphttp://geojson.org/

It means that even if your GeoJSON is correctly generated, you won’t be able to convert it into a shapefile format using the ArcGIS conversion tool mentioned above.

Another option would be using ArcGIS Pro or the online tool for the conversion of open standard GeoJSON to shp: 

https://mygeodata.cloud/converter/geojson-to-shp

https://mapshaper.org/

And there are some other open source tools for the same purpose too:-)

Research on Multi-Scale Spatio-temporal Analysis of Human Emotions

In our research, state-of-the-art computer vision and AI technologies are utilized to collect, store, handle, manipulate and analyze the human emotions and sentiment at different geographic scales. The research explored what and how people express their emotions at different places, and why and how their emotions would be influenced by environmental factors. Several maps are utilized to visualize where people may be happier than at other locations. In traditional research, we may only use questionnaires to investigate the human emotions and socioeconomic factors. But nowadays, it is possible to collect human emotions using large-scale user generated data online, including tweets, emoji, photos, articles, etc.. As we know, human emotions are innate characteristics of human beings, and with computer technology, it is possible to use objective methods to quantify the subjective human emotion. And it is quite important to build a computational workflow to handle large volumes of user generated data and extract emotion from those data efficiently. Here are several examples which we are working on.

(1) Individual place scale: human emotions at different tourist attractions

In this study, a novel framework for extracting human emotions from large-scale georeferenced photos at different places is proposed. After the construction of places based on spatial clustering of user generated footprints collected in social media websites, online cognitive services are utilized to extract human emotions from facial expressions using state-of-the-art computer vision techniques. And two happiness metrics are defined for measuring the human emotions at different places. To validate the feasibility of the framework, we take 80 tourist attractions around the world as an example and a happiness ranking list of places is generated based on human emotions calculated over 2 million faces detected out from over 6 million photos. Different kinds of geographical contexts are taken into consideration to find out the relationship between human emotions and environmental factors. Results show that much of the emotional variation at different places can be explained by a few factors such as openness. The research may offer insights on integrating human emotions to enrich the understanding of sense of place in geography and in place-based GIS.

The spatial distribution of 80 tourist sites and their associated emotion indices using facial expression.

(2) Urban scale: relationship between human emotion and stock market fluctuation at Manhattan

In this research, we examined whether emotion expressed by users in social media can be influenced by stock market index or can predict the fluctuation of the stock market index. We collected the emotion data in Manhattan, New York City using face detection technology and emotion cognition services for photos uploaded to Flickr. Each face’s emotion was described in 8 dimensions the location was also recorded. An emotion score index was defined based on the combination of all 8 dimensions of emotion calculated by principal component analysis. The correlation coefficients between the stock market values and emotion scores are significant (R>0.59 with p < 0.01). Using Granger Causality analysis for cause and effect detection, we found that users’ emotion is influenced by stock market value change. A multiple linear regression model was established (R-square=0.76) to explore the potential factors that influence the emotion score. Finally, a sensitivity map was created to show sensitive areas where human emotion is easily affected by the stock market changes. We concluded that in Manhattan region: (1) there is a statistically significant relationship between human emotion and stock market fluctuation; (2) emotion change follows the movements of the stock market; (3) the Times Square and Broadway Theatre are the most sensitive regions in terms of public emotional reaction to the economy represented by stock value.

(3) Global scale: global human emotions in different groups of people

In this research, we used a huge global scale image dataset: YFCC100, to extract emotions from photos and to describe the worldwide geographic patterns of human happiness. Two indices of Average Smiling Index (ASI) and Happiness Index (HI) are defined from different perspectives to describe the degree of human happiness in a specific region. We computed the spatio-temporal characteristics of facial expression-based happiness on a global scale and linked them to some demographic variables (ethnicity, gender, age, and nationality). After that, the robust analysis was made to ensure our results are reliable. Results are in accordance with some previous studies in Social Science. For example, White and Black are often better at expressing happiness than Asian, women are more expressive than men, and happiness expressed varies across space and time. Our research provides a novel methodology for emotion measurement and it could be utilized for assessing a region‘s emotion conditions based on geo-crowdsourcing data. Robust analysis results indicate that our approaches are reliable and could be implemented for other research projects on place-based human sentiment analysis.

For more information about this research, you can also visit: http://urbanplayground.cn/Emotion/

References:

Yuhao Kang, Qingyuan Jia, Song Gao, Xiaohuan Zeng, Yueyao Wang, Stephan Angsuesser , Yu Liu, Xinyue Ye, Teng Fei. (2019)  Extracting Human Emotions at Different Places Based on Facial Expressions and Spatial Clustering Analysis. Transactions in GIS (in press)

Kang, Y., Wang, J., Wang, Y., Angsuesser, S. and Fei, T. (2017) Mapping the Sensitivity of the Public Emotion to the Movement of Stock Market Value: A Case Study of Manhattan. International Archives of the Photogrammetry, Remote Sensing & Spatial Information Sciences42.

Kang, Y., Zeng, X., Zhang, Z., Wang, Y. and Fei, T. (2018, March) Who are happier? Spatio-temporal Analysis of Worldwide Human Emotion Based on Geo-Crowdsourcing Faces. In 2018 Ubiquitous Positioning, Indoor Navigation and Location-Based Services (UPINLBS) (pp. 1-8). IEEE.