Prof. Gao receives a new geospatial data science research grant

The American Family Insurance Data Science Institute (AFIDSI) is honored to announce the results of the new round of the American Family Funding Initiative, a research competition for data science projects. American Family Insurance has partnered with UW–Madison through the Institute to offer “mini grants” of $75k-to-150k per year for data science research. This is the second installation of a $10 million research agreement.

The goal of the American Family Funding Initiative is to stimulate and support highly innovative research. The successful projects, reviewed by faculty and staff from across UW-Madison campus, were evaluated based on their potential contributions to the field of data science, practical use and the novelty of their approaches.

AFIDSI brings people together to launch new research in data science and apply findings to solve problems. In collaboration with researchers across campus and beyond, AFIDSI focuses on the fundamentals of data science research and on translating that research into practice.

New projects funded in the second round of the American Family Funding Initiative include:

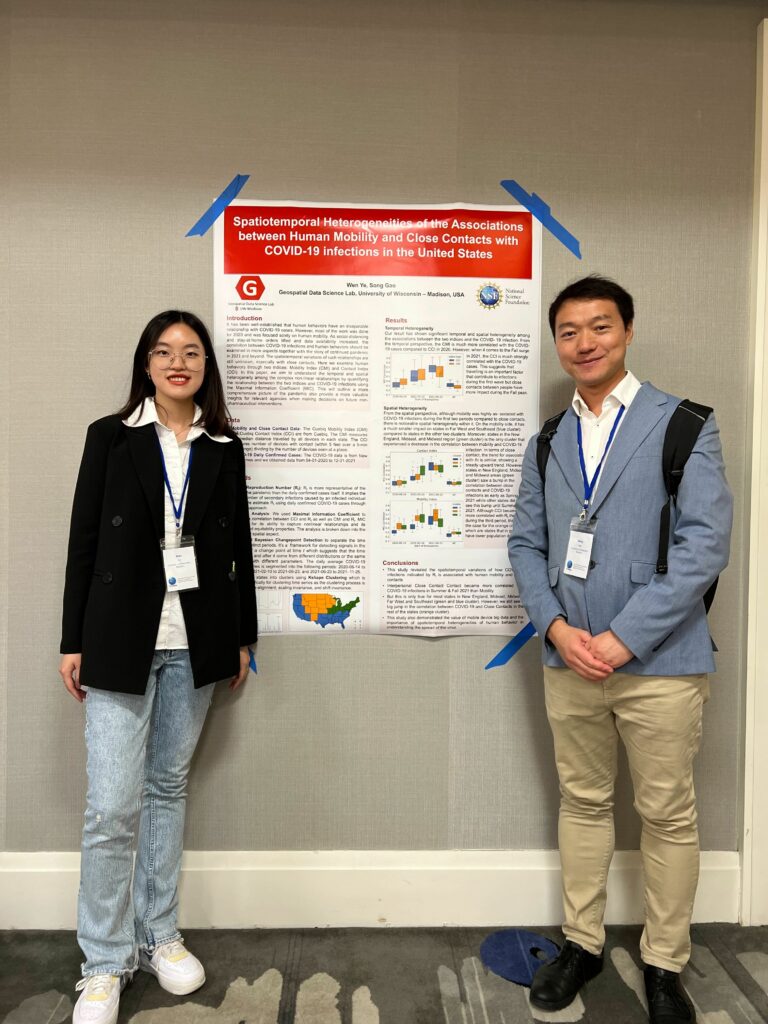
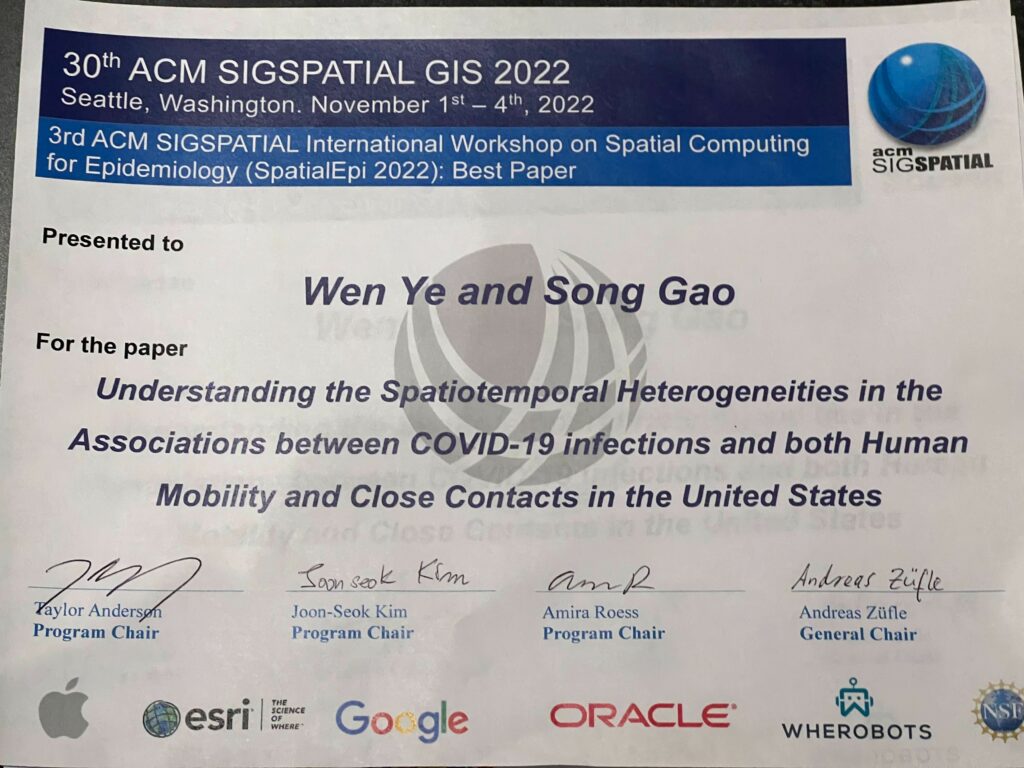
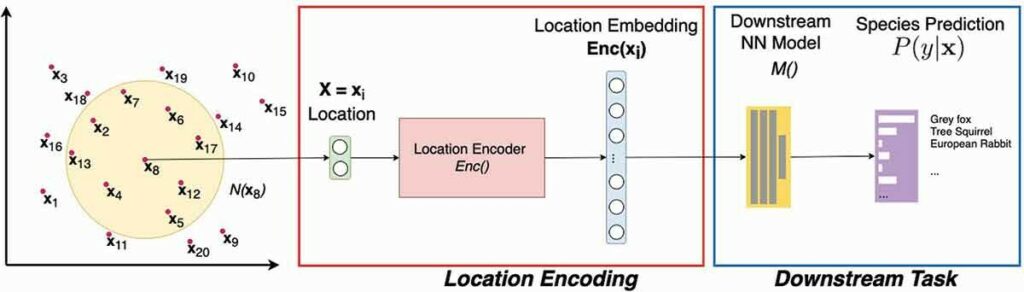
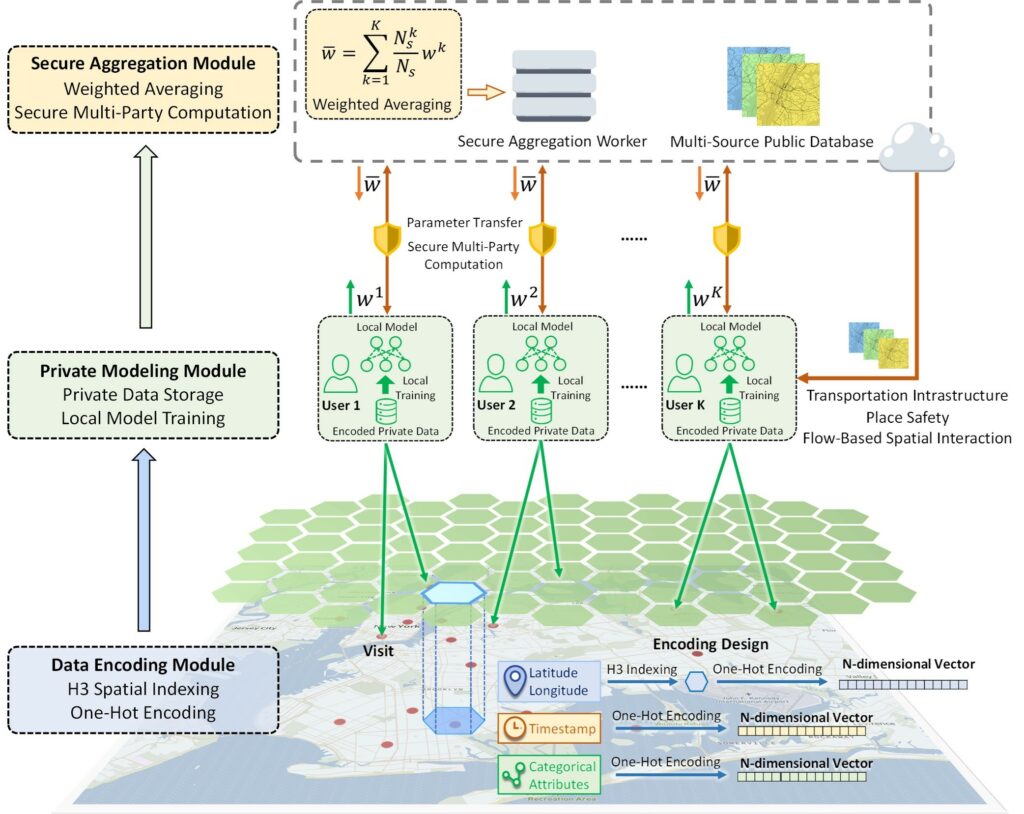
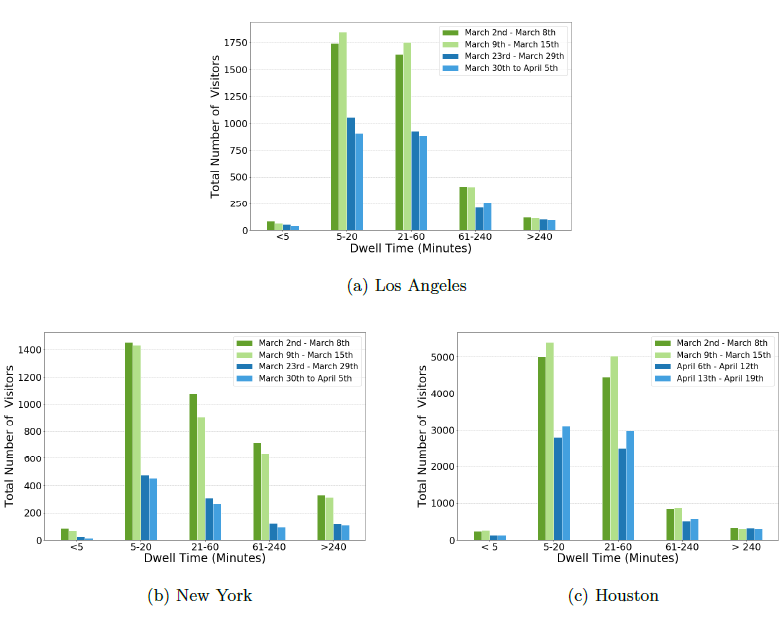
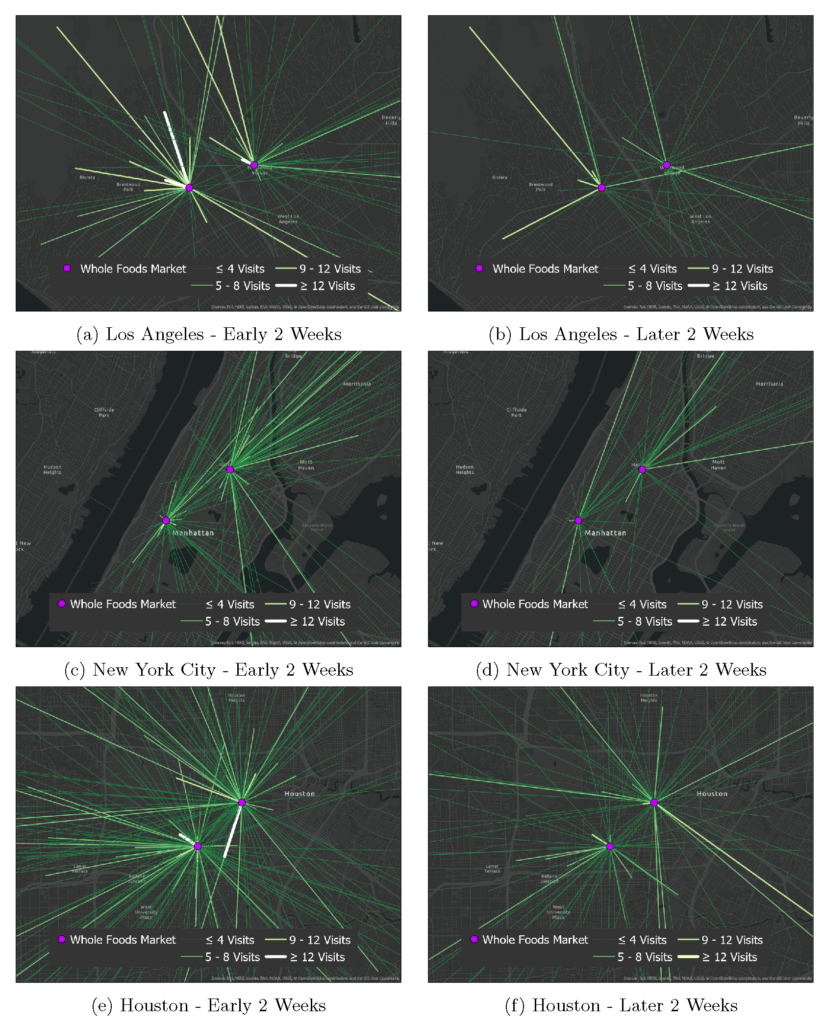
A Deep Learning Approach to User Location Privacy Protection
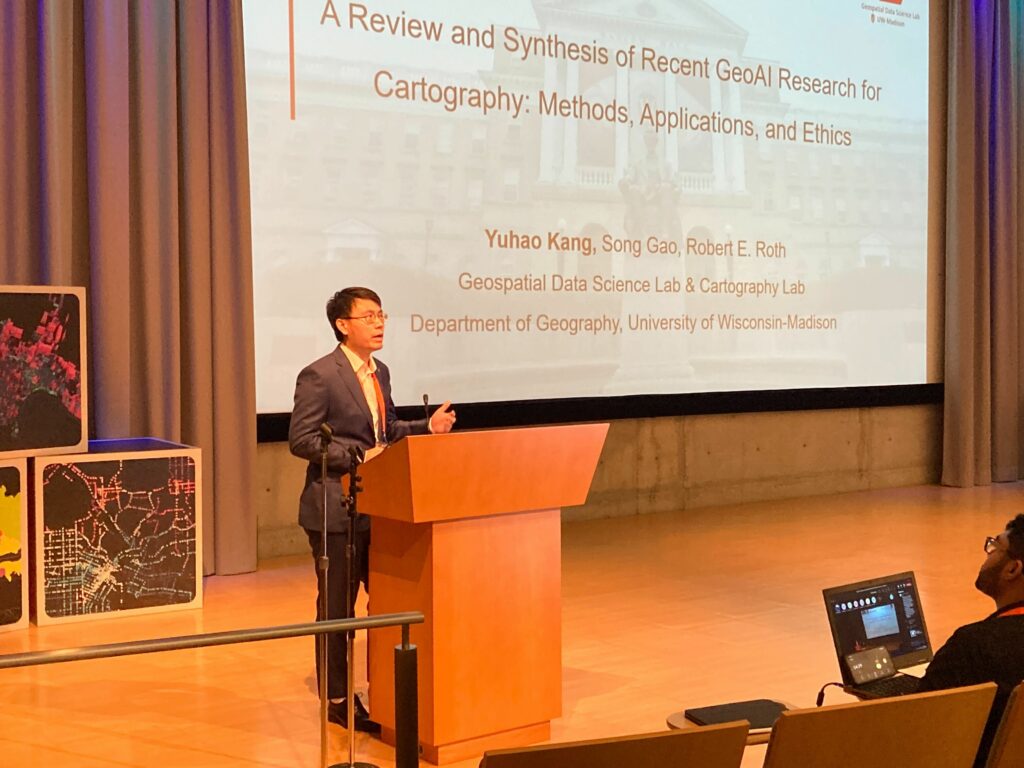
Principal Investigator: Song Gao, Assistant Professor of Geography.
Co-Principal Investigator: Jerry Zhu, Computer Sciences.

Location information is among the most sensitive data being collected by mobile apps, and users increasingly raise privacy concerns. The proposed research aims to develop a deep learning architecture that will protect users’ location privacy while keeping the capability for location-based business recommendations such as usage-based insurance (UBI).

Machine Learning Approaches for Metadata Standardization
Principal investigator: Colin Dewey, Professor of Biostatistics and Medical Informatics.
Co-Principal Investigator: Mark Craven, Biostatistics and Medical Informatics.

The need to manually standardize metadata describing records in large data sets, compiled from many sources, is a major bottleneck in both research and business. This project will develop machine learning approaches for automating metadata standardization and identifying records that would most benefit from expert human input.

Adaptive Operations Research and Data Modeling for Insurance Applications
Principal Investigator: Michael Ferris, Professor of Computer Sciences.

Insurance claims applications must be operated efficiently under normal conditions and allow for rapid reconfiguration in crisis situations. The proposed work will develop optimization models, data and solution processes to schedule resources over time, servicing normal workloads, while creating resilience to abrupt changes from random disturbances.

GAN-mixup: A New Approach to Improve Generalization in Machine Learning
Principal Investigator: Kangwook Lee, Assistant Professor of Electrical and Computer Engineering.
Co-Principal Investigator: Dimitris Papailiopoulos, Electrical and Computer Engineering.

Recent machine learning successes rely on predictive models that adapt to previously unseen data. This research will provide a new approach to improve such generalization, with provable performance guarantees.

Integer Programming for Mixture Matrix Completion
Principal Investigator: Jeff Linderoth, Professor of Industrial and Systems Engineering.
Co-Principal Investigators: Jim Luedtke, Industrial and Systems Engineering; Daniel Pimentel-Alarcon, Biostatistics and Medical Informatics.

Matrix completion, or filling in the unknown entities in a matrix, is used in applications such as recommender systems and systems for analyzing visual images. This project will apply integer programming techniques to develop algorithms for solving a mixture matrix completion problem, paving the way towards applying this method to large-scale data science problems.

Developing a State-of-the-Science Regional Weather Forecasting System
Principal Investigator: Michael Morgan, Professor of Atmospheric and Oceanic Sciences.
Co-Principal Investigator: Brett Hoover, Space Science and Engineering Center.

This project will develop a weather prediction system for American Family Insurance, run entirely in cloud computing infrastructure, that will improve the accuracy of forecasting hazards such as hail and hurricanes. The probabilistic system will also estimate the uncertainty associated with the predictability of hazardous weather.

Model Recycling: Accelerating Machine Learning by Re-using Past Completions
Principal Investigator: Shivaram Venkataraman, Assistant Professor of Computer Sciences.
Co-Principal Investigator: Dimitris Papailiopoulos, Electrical and Computer Engineering.

Training machine learning models that are used in a wide range of domains, from drug discovery to recommendation engines, takes significant time and resources. This project will automate and accelerate this process of fine-tuning by reusing and sharing past computations from prior training jobs, using a technique called model recycling.

Additionally, two projects from the first round received continued funding:

Question Asking with Differing Knowledge and Goals
Principal investigator: Joe Austerweil, Assistant Professor of Psychology.

Despite tremendous progress in machine learning, automated answers to questions are still inferior to answers from humans. This project investigates whether incorporating psycholinguistic factors that influence how people respond to language can improve automated question-answering methods.

Lightweight Natural Language and Vision Algorithms for Data Analysis
Principal investigator: Vikas Singh, Professor of Biostatistics and Medical Informatics. Collaborators: Zhanpeng Zeng, Computer Sciences; Shailesh Acharya and Glenn Fung, American Family Insurance.

Natural language processing is a form of artificial intelligence that helps computers read and understand human language. The overarching goal of this project is to accelerate the time it takes to train and test efficient, accurate natural language processing models.

National Fellowships Engage Geospatial Research And Education On COVID-19

Projects address human mobility patterns, access to health care and food systems, racial and disability disparities during the pandemic.

The Geospatial Software Institute (GSI) Conceptualization Project has announced 16 fellowships to researchers at 13 institutions to tackle COVID-19 challenges using geospatial software and advanced capabilities in cyberinfrastructure and data science. Prof. Song Gao was selected as one of the geospatial fellows. A full list of the fellows, with biographies and project information, is at https://gsi.cigi.illinois.edu/geospatial-fellows-members/.

The GSI Conceptualization Project is supported by the National Science Foundation (NSF), and carried out in partnership with the American Association of Geographers (AAG), Consortium of Universities for the Advancement of Hydrologic Science, Inc. (CUAHSI), the National Opinion Research Center (NORC) at the University of Chicago, Open Geospatial Consortium (OGC), and University Consortium for Geographic Information Science (UCGIS). Technical and cyberinfrastructure support are provided by the CyberGIS Center for Advanced Digital and Spatial Studies (CyberGIS Center)  at the University of Illinois at Urbana-Champaign. 

“The COVID-19 crisis has shown how critical it is to have cutting-edge geospatial software and cyberinfrastructure to tackle the pandemic’s many challenges,” said Shaowen Wang, the principal investigator of the NSF project and founding director of the CyberGIS Center. “We are extremely grateful for NSF’s support to fund this talented group of researchers, whose work is so diverse yet complementary.”

Michael Goodchild, chair of the NSF project advisory committee and professor emeritus in geography at UC-Santa Barbara, agreed. “Geospatial data and tools have enormous potential for helping us address the challenges of COVID-19, and these 16 Fellows have exactly the right qualifications and experience. I’m very excited to see what they are able to achieve.”

The Fellows come from varied professional, cultural, and institutional backgrounds, representing many disciplinary areas, including public health, food access, emergency management, housing and neighborhood change, and community-based mapping. The fellowship projects represent frontiers of emerging geospatial data science, including for example geospatial AI and deep learning, geovisualization, and advanced approaches to gathering and analyzing geospatial data.

Pioneered by multi-million dollar research funded by NSF, cyberGIS (i.e., cyber geographic information science and systems based on advanced computing and cyberinfrastructure) has emerged as a new generation of GIS, comprising a seamless integration of advanced cyberinfrastructure, GIS, and spatial analysis and modeling capabilities while leading to widespread research advances and broad societal impacts. Built on the progress made by cyberGIS-related communities, the GSI conceptualization project is charged with developing a strategic plan for a long-term hub of excellence in geospatial software infrastructure, one that can better address emergent issues of food security, ecology, emergency management, environmental research and stewardship, national security, public health, and more.

The Geospatial Fellows program will enable diverse researchers and educators to harness geospatial software and data at scale, in reproducible and transparent ways; and will contribute to the nation’s workforce capability and capacity to utilize geospatial big data and software for knowledge discovery. With a particular focus on COVID-19, the combined research findings of the Fellows will offer insight on how to make geospatial research computationally reproducible and transparent, while also developing novel methods, including analysis, simulation, and modeling, to study the spread and impacts of the virus. The Fellows’ research will substantially add to public understanding of the societal impacts of COVID-19 on different communities, assessing the social and spatial disparities of COVID-19 among vulnerable populations.

“I look forward to seeing the results of these projects, particularly as FAIR and open datasets, software, and models that others can then build on,” says Daniel S. Katz, Assistant Director for Scientific Software and Applications at the National Center for Supercomputing Applications (NCSA), the University of Illinois.

For more information about the GSI conceptualization project, see their website: https://gsi.cigi.illinois.edu/.

For a list of Geospatial Fellows and their projects, visit https://gsi.cigi.illinois.edu/geospatial-fellows-members/.

Location Big Data for Business Analytics

Reference: Yunlei Liang, Song Gao, Yuxin Cai, Natasha Z. Foutz, Lei Wu. (2020) Calibrating the dynamic Huff model for business analysis using location big data. Transactions in GIS, 24(3), 681-703.

Abstract: The Huff model has been widely used in location‐based business analysis to delineate a trade area containing a store’s potential customers. Calibrating the Huff model and its extensions requires empirical location visit data. Many studies rely on labor‐intensive surveys. With the increasing availability of mobile devices, users in location‐based platforms share rich multimedia information about their locations at a fine spatio‐temporal resolution, which offers opportunities for business intelligence. In this research, we present a time‐aware dynamic Huff model (T‐Huff) for location‐based market share analysis and calibrate this model using large‐scale store visit patterns based on mobile phone location data across the 10 most populated US cities. By comparing the hourly visit patterns of two types of stores, we demonstrate that the calibrated T‐Huff model is more accurate than the original Huff model in predicting the market share of different types of business (e.g., supermarkets versus department stores) over time. We also identify the regional variability where people in large metropolitan areas with a well‐developed transit system show less sensitivity to long‐distance visits. In addition, several socioeconomic and demographic factors (e.g., median household income) that potentially affect people’s visit decisions are examined and summarized.

The Whole Foods Markets in Los Angeles with their temporal visit probability.
The spatial distributions of CBGs that have visit flows to five Whole Foods Markets.
The probability density distribution, empirical cumulative distribution, and log-log plots of visitors’ distance from home to supermarkets and grocery stores (NACIS: 445110) and to department stores (NACIS: 452210) in the top 10 most populated cities in US.
(a) Estimated market share of five Whole Foods Market stores in Los Angeles using the original Huff model; and (b) Actual market share derived from the SafeGraph visit database.

New Research Paper on Trajectory Privacy Protection accepted in GIScience 2021

Reference: Rao, J., Gao, S., Kang, Y., & Huang, Q. (2020). LSTM-TrajGAN: A Deep Learning Approach to Trajectory Privacy Protection. In the Proceedings of the 11th International Conference on Geographic Information Science (GIScience 2021), No. 12; pp. 12:1–12:17. DOI: 10.4230/LIPIcs.GIScience.2021.12 [PDF]

Abstract: The prevalence of location-based services contributes to the explosive growth of individual-level trajectory data and raises public concerns about privacy issues. In this research, we propose a novel LSTM-TrajGAN approach, which is an end-to-end deep learning model to generate privacy-preserving synthetic trajectory data for data sharing and publication. We design a loss metric function TrajLoss to measure the trajectory similarity losses for model training and optimization. The model is evaluated on the trajectory-user-linking task on a real-world semantic trajectory dataset. Compared with other common geomasking methods, our model can better prevent users from being re-identified, and it also preserves essential spatial, temporal, and thematic characteristics of the real trajectory data. The model better balances the effectiveness of trajectory privacy protection and the utility for spatial and temporal analyses, which offers new insights into the GeoAI-powered privacy protection.

New IJGIS Editorial on Movement Data Science

There has not been a time in the history of GIScience when movement analytics and mobility insights have played such an important role in policymaking as in today’s global responses to the COVID-19 crisis. This special section further builds on previous efforts by the editorial team and others from the GIScience community and beyond to advance the body of knowledge in Computational Movement Analysis (CMA). CMA generally refers to series methods and analytical approaches to process, structure, visualize and analyze tracking data and movement patterns to facilitate knowledge discovery and modeling of movement. Specifically, this special section was proposed as part of a pre-conference workshop on Analysis of Movement Data (AMD 2018) at the GIScience 2018 meeting, 28 August 2018, Melbourne, Australia. The focus of this special section is on three aspects of CMA: (1) representation and modeling of movement; (2) urban mobility analytics; and (3) movement analytics using social media data. With the papers presented in the special section, we highlight recent advancements in CMA with the development of methods and techniques for big movement data analytics and utilization of trajectories constructed using user-generated crowdsourced contents such as geo-tagged social media posts. Traditional CMA methods were often developed and evaluated using a smaller set of movement data involving smaller numbers of individuals and contextual variables.

As the momentum to generate more geo-enriched movement data at large volumes, high frequencies and for longer durations continues, this is a timely and significant achievement towards movement data science. As the papers of this special section illustrate, movement data science leverages the advancements in big data analytics, cyberinfrastructure, parallel computing and data fusion to enhance the analysis of large, multi-faceted and multi-sourced movement data. Below are the editorial and the six original papers presented in this special section on the International Journal of Geographical Information Science (IJGIS). 

Dodge, S., Gao, S., Tomko, M., & Weibel, R. (2020). Progress in computational movement analysis – towards movement data science. International Journal of Geographical Information Science, 1-6.

Buchin, M., Kilgus, B., & Kölzsch, A. (2019). Group diagrams for representing trajectories. International Journal of Geographical Information Science, 1-33.

Graser, A., Widhalm, P., & Dragaschnig, M. (2020). The M³ massive movement model: a distributed incrementally updatable solution for big movement data exploration. International Journal of Geographical Information Science, 1-24.

Qiang, Y., & Xu, J. (2019). Empirical assessment of road network resilience in natural hazards using crowdsourced traffic data. International Journal of Geographical Information Science, 1-17.

Li, W., Wang, S., Zhang, X., Jia, Q., & Tian, Y. (2020). Understanding intra-urban human mobility through an exploratory spatiotemporal analysis of bike-sharing trajectories. International Journal of Geographical Information Science, 1-24.

Ma, D., Osaragi, T., Oki, T., & Jiang, B. (2020). Exploring the heterogeneity of human urban movements using geo-tagged tweets. International Journal of Geographical Information Science, 1-22.

Xin, Y., & MacEachren, A. M. (2020). Characterizing traveling fans: a workflow for event-oriented travel pattern analysis using Twitter data. International Journal of Geographical Information Science, 1-20.

Moving forward, we see a clear need for more reproducible research in CMA, following a growing mega-trend in data-driven sciences. Data quality and privacy challenges as well as uncertainty in data, analytics, and modeling have been largely overlooked in the CMA literature so far. For a more responsible movement data science, careful considerations should be given to the quality, uncertainty and representativeness of ‘large’ mobility data that are being used for generating important mobility insights for policymaking. Lastly, with the recent exciting developments in data access, as a community, we should think about leveraging this advantage to make movement data science more relevant to real-world problems for the mitigation of societal and environmental challenges such as disease outbreaks, population mobility, natural hazards and human-wildlife conflicts.

Link: GIScience 2020 Workshop on Advancing Movement Data Science (AMD’20) turns to 2021

Prof. Gao received the 2020 Distinguished Honors Faculty Award

Each year, the University of Wisconsin-Madison College of Letters & Science Honors Program solicits student nominations of faculty members (or instructional academic staff) who have had a special impact as teachers of Honors courses, as supervisors of Honors theses, or as teachers and mentors of Honors students. The Faculty Honors Committee reviews these nominations and votes to confer Distinguished Honors Faculty status on the strongest nominees for these awards each spring. Below, we recognize each of these incredible educators and thank them for their contributions to the lives of all students, but particularly those in the Honors program.

This year, Prof. Song Gao received the 2020 Distinguished Honors Faculty Award along with five other faculty members on campus.

Also, congrats to Timothy Prestby for finishing his L&S undergraduate honor thesis “Understanding Neighborhood Isolation Through Big Data Human Mobility Analytics”. Best wishes to his graduate school life at PSU Geography!

Digital Contact Tracing and Surveillance: Geospatial opportunities, limitations, and research directions

Reference: Trisalyn Nelson, Peter Kedron,  Michael F. Goodchild,  Stewart Fotheringham,  Amy Frazier,  Wenwen Li, Song Gao, Yingjie Hu,  Ming-Hsiang Tsou, May Yuan, Bo Zhao (2020). Digital Contact Tracing and Surveillance: Geospatial opportunities, limitations, and research directions. ASU Spatial Analysis Research Center (SPARC) White Paper. pp 1-13.

Executive Summary

As efforts to mitigate and suppress COVID-19 continue, many decision makers are asking if digital contact tracing—a method for determining contact between an infected individual and others using tracking systems commonly based on mobile devices—can help us safely transition from population-wide social distancing to targeted case-based interventions such as individualized self-quarantine. In response, the Spatial Analysis Research Center (SPARC) at Arizona State University organized a panel of national experts to discuss the use of geospatial technologies in digital contact tracing and identify the practical challenges researchers can address to make digital contact tracing as effective as possible.

The major themes of the discussion included (i) the capabilities and limitations of geospatial technology, (ii) privacy, and (iii) future research directions. Key takeaways from each of these areas include:

Capabilities and limitations of geospatial technology: There are many geospatial technologies (e.g., GPS, Bluetooth, Cellular, WiFi) embedded in mobile devices that can be leveraged for digital contact tracing. However, GPS technology in smartphones lacks accuracy to map interactions in the detailed way one might expect. For instance, the horizontal accuracy of GPS is 15m, and the vertical accuracy is insufficient to pick up which floor of a building a person is on. Indoor accuracy is particularly poor, which is problematic given people spend 87% of their time indoors. However, information about the absolute location of an individual may not be as important to digitally tracing epidemiologically meaningful contacts as identifying the types of interactions most likely to result in the spread of the virus. The importance of tracing interactions creates an opportunity to use Bluetooth-based exchange of encrypted keys to record person-to-person contacts that can then be analyzed within the space-time prism framework. This approach will not require storing of all individuals’ movement data, which will reduce computation complexity. Geotargeted and geotagged social media are useful for tracking transmission between cities or within cities, detecting large gatherings, and helping individuals recall location and contact history during contact tracing interviews. Social media can also provide useful context, such as check-in locations and textual content, to reduce false positives in interactions identified through other forms of digital contact tracing.

Privacy: Digital contact tracing raises numerous privacy concerns. By creating some record of the location history or contacts of an individual, digital contact tracing creates an opportunity to identify an individual without their consent. At present, the privacy implications of digital contact tracing are unclear because these systems have yet to be fully developed or deployed in the US. An evaluation of pros and cons in the existing digital contact tracing plans operating in other countries can inform policy makers on privacy mediation during and after contact tracing. While companies and officials working on this issue have made statements that preserving privacy is an important goal, the details of how privacy will be preserved and the safeguards that will be put in place are not yet available. If any privacy protections are lifted to enable contact tracing, a plan should be put in place to restore protections once the pandemic subsides.

Future Research: To support digital contact tracing and surveillance, several research areas must be advanced. Key technical areas include increasing the accuracy of indoor positioning, developing approaches for reducing false positive of potential exposure (not to be confused with false negatives which are more common in COVID-19 diagnostic test) ensuring a focus on high accuracy in relative positioning, addressing computational complexities, developing group or bubble based approaches to surveillance, and developing a system for the creation and distribution of high resolution risk data and to enable self-determination of the need of quarantine and testing based on possible exposure. Research into how digital contact tracing systems link with existing contact tracing infrastructure and with other digital contact tracing systems also needs to be conducted. The implications of digital contact tracing for society and privacy will emerge along with these systems. Researchers need to study these issues as they emerge to ensure that we have the ability to hold an informed public debate about the effectiveness and costs of digital contact tracing.

GeoDS Lab members won multiple awards in the AAG 2020 Annual Meeting

Due to the COVID-19 pandemic, The American Association of Geographers (AAG)  2020 Annual Conference was held online virtually. GeoDS Lab members participated the meeting and fortunately won several awards as follows.

Congratulations to Yuhao Kang who won the 1st place in the 2020 AAG GIS Specialty Group Annual Best Student Paper Competition and the 2020 AAG Cartography Specialty Group Master’s Thesis Research Grant.
http://aag-giss.org/2020-aag-geographic-information-science-and-systems-specialty-group-annual-student-paper-competition-winners/

https://aagcartography.wordpress.com/awards-competitions/masters-thesis-research-grant/

In addition, GeoDS Lab’s recent COVID-19 mapping work was awarded the winner of static mapping group for the “AAG Health and Medical Geography Health Data Visualization Contest”.

Also, GeoDS Lab’s recent COVID-19 work was featured by the AAG Newsletter:

http://news.aag.org/2020/03/geographers-act-on-covid19/

County-to-County- Spring Travel Flow Tracking

Prof. Gao received a NSF RAPID grant in response to COVID-19

Recently, a multidisciplinary research team led by Prof. Song Gao (Geography) who serves as the Principal Investigator (PI) and collaborates with three other Co-PIs at UW-Madison: Prof. Kaiping Chen (Life Sciences Communication), Prof. Qin Li (Mathematics), and Prof. Jonathan Patz (Population Health Sciences), was awarded an NSF RAPID grant in response to the COVID-19 pandemic. The project title is: “Geospatial Modeling of COVID-19 Spread and Risk Communication by Integrating Human Mobility and Social Media Big Data”.

This project will investigate the gap between the science of epidemic modeling and risk communication to the general public in response to the COVID-19 pandemic. With the rapid development of information, communication, and technologies, new data acquisition and assessment methods are needed to evaluate the risk of epidemic transmission and geographic spreading from the community perspective, to help effectively monitor social distancing policies, and to understand social disparities and environmental contexts in risk communication. This project will make theoretical, methodological, and practical contributions that advance the understanding of the COVID-19 spread across both time and space. The communication aspects of this research will serve to educate communities about the science, timing, and geography of virus transmission in order to enhance actions for addressing such global health challenges. This project explores the capabilities and potential of integrating social media big data and geospatial artificial intelligence (GeoAI) technologies to enable and transform spatial epidemiology research and risk communication. Results will be disseminated broadly to multiple stakeholder groups. Further, this project will support both researchers and students from underrepresented groups, broadening participation in STEM fields. Lastly, the Web platform developed in this project will serve as an education tool for students in geography, communication, mathematics, and public health, as well as for effectively engaging with communities about the science of COVID-19.

Past health research mainly focuses on quantitative modeling of human transmission using various epidemic models. How to effectively communicate the science of an epidemic outbreak to the general public remains a challenge. When an epidemic outbreak occurs without specific controls in place, it can be particularly challenging to improve community risk awareness and action. The research team, composed of experts from geography, mathematics, public health and life sciences communication will (1) develop innovative mathematical predictive models that integrate spatio-temporal-social network information and community-centered approaches; (2) integrate census statistics, human mobility and social media big data, as well as policy controls to conduct data-synthesis-driven and epidemiology-guided risk analysis; And (3) utilize panel surveys and text mining techniques on social media data for better understanding public awareness of COVID-19 and for investigating various instant message and visual image strategies to effectively communicate about risks to the public. The results of this project will lead to a better understanding of the geography and spread of COVID-19. Additionally, it is expected that the methods developed in this project can be applied to mitigate the outbreak risks of future epidemics.

The research team will also collaborate with The Wisconsin State Cartographer’s Office (SCO), The Wisconsin Department of Health Services (DHS), The American Family Insurance Data Science Institute (DSI), and The Global Health Institute (GHI).

Read our recent work: Mobile location big data can help predict the potential infected areas as coronavirus spreads


Mobile location big data can help predict the potential infected areas as coronavirus spreads

The travels and close contact-tracing from/to infected communities is useful for identifying potential hotspots and assessing the potential risk across different places. A recent research published in Science showed that “substantial undocumented infection facilitates the rapid dissemination of novel coronavirus (SARS-CoV2) “. Understanding the human physical movement patterns and social contacts is a key for saving more lives as one may be surrounded by latent exposed people who don’t show SARS-CoV2 symptoms. Therefore, human mobility patterns and changes could be one indicator for understanding the status of physical social distancing. Here are the neighborhood mobility pattern and the Spring 2019 and March 2020 travel patterns for US cities and counties using the anonymized and aggregated mobile phone location big data in collaboration with SafeGraph, which covers over 3.6 million points of interest (POI) and business venues with visit patterns. Meanwhile, we are working on the whole US 2020 census block data and monitoring new infected areas from the CDC and from a list of Coronavirus dashboards in response to COVID-19.

Reference: Gao, S., Rao, J., Kang, Y., Liang, Y., & Kruse, J. (2020). Mapping county-level mobility pattern changes in the United States in response to COVID-19. SIGSPATIAL Special. 12(1), 16-26.

The spatial density distribution of over 3.6 million SafeGraph POIs with visit patterns.

The U.S. government, tech industry are discussing ways to harness smartphone location data to combat the novel coronavirus (COVID-19).

You can find out where people from those POIs / neighborhoods / a county connecting with other neighborhoods and counties across the US. By comparing the POI visits between last March and March 2020, we can summarize the changes and visualize the patterns on the maps to understand whether people in each County/State has reacted to (Physical) Social Distancing.

Interactive Web: Mapping Human Mobility Changes at the County level since March 1, 2020

Mapping Human Mobility Changes at the County level in March, 2020 (Data Source: Descartes Labs )
See also: https://www.nytimes.com/interactive/2020/03/23/opinion/coronavirus-economy-recession.html

Interactive Web on COVID-19 Physical Distancing and the relation with the infectious cases in Wisconsin (Using the latest SafeGraph weekly movement patterns in March 2020): https://geods.geography.wisc.edu/covid19/WI/

In addition, the maps below show the origin-destination (OD) flows larger than a travel frequency threshold at different spatial scales. The one at the urban scale can help understand the potential spread and hotspots in a city/metropolitan area.

Interactive Web: geods.geography.wisc.edu/covid19/King_WA.html (Notice that some paired neighborhood-to-neighborhood flows are not shown after the data filtering based on OD flow frequency)
Interactive Web: https://geods.geography.wisc.edu/covid19/King_US.html (neighborhood mobility to San Francisco, Alaska, Boston, and New York, etc. stand out. )

Spring Travel Risk

By using the county-level Spring travel data in March, we can see thousands of trips generated from the U.S. counties in the Spring season and widely across the U.S., which may help explain the rapid growth of infection cases across the whole U.S. Our travel-augmented SEIR epidemic modeling results showed that only about 20% of infected cases reported (with testing) at the state level in the US.

Chen, S., Li, Q., Gao, S., Kang, Y.,& Shi, X.(2020). State-specific Projection of COVID-19 Infection in the United States and Evaluation of Three Major Control Measures. Scientific Reports, 1-9, www.nature.com/articles/s41598-020-80044-3.

Interactive Web demo: Dane County, WI

The spring travels from the Dane County, WI with current U.S. confirmed cases: http://geods.geography.wisc.edu/covid19/WI_DaneCounty.html

Interactive Web: The King County, WA https://geods.geography.wisc.edu/covid19/KingCounty_Spring.html

Spring travels patterns aggregated at the Country-level in March 2019 from the people who reside in the King County, WA
Spring travels patterns aggregated at the County-level in March 2019 from the people who reside in the King County, WA
(Zoom in to the Pacific Coast Map) Spring travels patterns aggregated at the County-level in March 2019 from the people who reside in the King County, WA

The following table shows the top 20 counties which the people reside in the King County traveled to in March 2019.

And using the Country-to-US Counties flow data from last March, we can assess how the global travels from other countries outside of US will influence the potential coronavirus outbreak and spread in the US.

The spring international travels to US in March 2019. (filtered by at least 100 people)
The spring travels from China and Japan in March 2019.

Credit: The data sources were from SafeGraph Inc., Descartes Labs, and the Web geovisualization was created using the Kepler.gl tool.

Acknowledgment: We would like to thank all individuals and organizations for collecting and updating the COVID-19 observation data and reports. Dr. Song Gao acknowledges the funding support provided by the National Science Foundation (Award No. 2027375). Any opinions, findings, and conclusions or recommendations expressed in this material are those of the author(s) and do not necessarily reflect the views of the National Science Foundation.

New research article about Regional Economy and Transportation Network Analytics published in Scientific Reports

Bin Li, Song Gao, Yunlei Liang, Yuhao Kang, Timothy Prestby, Yuqi Gao, and Runmou Xiao. (2020) “Estimation of Regional Economic Development Indicator from Transportation Network Analytics.” Scientific Reports, 10(2647), 1-15. DOI: https://doi.org/10.1038/s41598-020-59505-2

Abstract: With the booming economy in China, many researches have pointed out that the improvement of regional transportation infrastructure among other factors had an important effect on economic growth. Utilizing a large-scale dataset which includes 3.5 billion entry and exit records of vehicles along highways generated from toll collection systems, we attempt to establish the relevance of mid-distance land transport patterns to regional economic status through transportation network analyses. We apply standard measurements of complex networks to analyze the highway transportation networks. A set of traffic flow features are computed and correlated to the regional economic development indicator. The multi-linear regression models explain about 89% to 96% of the variation of cities’ GDP across three provinces in China. We then fit gravity models using annual traffic volumes of cars, buses, and freight trucks between pairs of cities for each province separately as well as for the whole dataset. We find the temporal changes of distance-decay effects on spatial interactions between cities in transportation networks, which link to the economic development patterns of each province. We conclude that transportation big data reveal the status of regional economic development and contain valuable information of human mobility, production linkages, and logistics for regional management and planning. Our research offers insights into the investigation of regional economic development status using highway transportation big data.

Fig. Mapping the annual traffic volumes of cars and buses among cities in Shaanxi province from 2014 to 2017.
Fig. The Pearson’s correlation coefficients between city GDP value, betweenness, closeness centrality measures and the PageRank index in transport flow networks of cars & buses (C) and trucks (K) in three provinces. The Betw (D) and Closeness (D) measures are calculated using the spatial interaction networks of cities with the inter-city distances as edge weights.

Fig. Mapping the annual traffic volumes of trucks among cities in Jiangsu province in 2017.
Fig. Mapping the annual traffic volumes of trucks among cities in Liaoning province in 2017.

Geomasking techniques for protecting the location privacy of social media users

Figure 1: The spatial distribution of geotagged tweets around a Twitter user’s home.

Reference: Song Gao, Jinmeng Rao, Xinyi Liu, Yuhao Kang, Qunying Huang, Joseph App. (2019) Exploring the effectiveness of geomasking techniques for protecting the geoprivacy of Twitter users. Journal of Spatial Information Science. 19, 105-129. DOI: 10.5311/JOSIS.2019.19.510 [PDF]

Abstract: With the ubiquitous use of location-based services, large-scale individual-level location data has been widely collected through location-awareness devices. Geoprivacy concerns arise on the issues of user identity de-anonymization and location exposure. In this work, we investigate the effectiveness of geomasking techniques for protecting the geoprivacy of active Twitter users who frequently share geotagged tweets in their home and work locations. By analyzing over 38,000 geotagged tweets of 93 active Twitter users in three U.S. cities (Los Angeles, Madison, and Washington D.C.), the two-dimensional Gaussian masking technique with proper standard deviation settings is found to be more effective to protect user’s location privacy while sacrificing geospatial analytical resolution than the random perturbation masking method and the aggregation on traffic analysis zones. Furthermore, a three-dimensional theoretical framework considering privacy, spatial analytics, and uncertainty factors simultaneously is proposed to assess geomasking techniques. Our research offers insights into geoprivacy concerns of social media users’ georeferenced data sharing for future development of location-based applications and services.

Figure 2: The Gaussian geomasking with different standard deviations (SD) and the random perturbation with 1km and 2km threshold of a user’s geotagged tweets.
Figure 10: The violin plot of distance shifts of tweet locations after geomasking.
Figure 11: A 3D-cube framework for assessing different geomasking techniques; the position of each method is estimated from the results of our case study.

Broader Impacts: In fact, Twitter removes support for precise geotagging since June, 2019. However, the metadata of historical tweets prior to the policy change may still reveal precise GPS coordinates. In addition, when a user deletes a geotagged tweet , Twitter does not guarantee the information will be completely removed from all copies of the data on third-party applications or in external search results. Even if the precise GPS location is not available anymore, Twitter users are still able to add place tags (e.g., a city, office building, apartment, landmark, and many other types of places) to their geotagged tweets, which can be converted to the GPS coordinates (often using the centroid as a representation location). This is similar to the aforementioned aggregation-based masking approach, thus we may still be able to get users’ sensitive locations based on fine-scale place tags. People should be aware that sharing or publishing such kind of location data involve geoprivacy issues and the geomasking technique provides a way to help mitigate the problem not only for Twitter users but also for other telematics and social media platforms such as Facebook, Flickr, Weibo, and Instagram where geotagging or place-tagging is accessible, as well as for mobile applications that track individual locations.

GeoAI at ACM SIGSPATIAL: progress, challenges, and future directions

Geospatial artificial intelligence (GeoAI) is an interdisciplinary field that has received tremendous attention from both academia and industry in recent years. We recently published an article that reviews the series of GeoAI workshops held at the Association for Computing Machinery (ACM) International Conference on Advances in Geographic Information Systems (SIGSPATIAL) since 2017. These workshops have provided researchers a forum to present GeoAI advances covering a wide range of topics, such as geospatial image processing, transportation modeling, public health, and digital humanities. We provide a summary of these topics and the research articles presented at the 2017, 2018, and 2019 GeoAI workshops. We conclude with a list of open research directions for this rapidly advancing field.

Reference: Yingjie Hu, Song Gao, Dalton Lunga, Wenwen Li, Shawn Newsam, and Budhendra Bhaduri (2019): GeoAI at ACM SIGSPATIAL: progress, challenges, and future directions, ACM SIGSPATIAL Special, 11(2), 5-15. [PDF]

ACM SIGSPATIAL GeoAI Workshop Proceedings:

1st ACM SIGSPATIAL International Workshop AI and Deep Learning for Geographic Knowledge Discovery (GeoAI’17). Redondo Beach, CA, USA – November 7, 2017. DOI: 10.1145/3178392.3178408 [PDF]

2nd ACM SIGSPATIAL International Workshop AI and Deep Learning for Geographic Knowledge Discovery (GeoAI’18). Seattle, WA, USA – November 6, 2018. DOI: 10.1145/3307599.3307609[PDF]

3rd ACM SIGSPATIAL International Workshop AI and Deep Learning for Geographic Knowledge Discovery (GeoAI’19). Chicago, IL, USA – November 5, 2019. DOI: 10.1145/3356471 [PDF]

New paper about investigating urban metro stations as cognitive places

New paper published in the journal of Cities.

Kang Liu, Peiyuan Qiu, Song Gao, Feng Lu, Jincheng Jiang, Ling Yin. (2020) Investigating urban metro stations as cognitive places in cities using points of interest. Cities. 97, 102561, 1-13. DOI: 10.1016/j.cities.2019.102561

Link: Map story presentation (open in a Web browser on PC or laptop)

Fig. 1. The proposed framework for extracting and understanding the cognitive regions of urban metro stations.

Abstract: The significance of urban metro stations extends beyond their roles as transport nodes in a city. Their surroundings are usually well developed and attract a lot of human activities, which make the metro station areas important cognitive places characterized by vague boundaries and rich semantics. Current studies mainly define metro station areas based on an estimation of walking distance to the stations (e.g., 700 m) and investigate these areas from the perspectives of transportation and land use instead of as cognitive places perceived by the crowd. To fill this gap, this study proposes a novel framework for extracting and understanding the cognitive regions of urban metro stations based on points of interest (POIs). First, we extract the cognitive regions of metro stations based on co-occurrence patterns of the stations and their surrounding POIs on web pages by proposing a cohesive approach combined of spatial clustering, web page extraction, knee-point detection, and polygon generation techniques. Second, we identify the semantics of metro stations based on POI types inside the regions using the term frequency-inverse document frequency (TF-IDF) method. In total 166 metro stations along with more than one million POIs in Shenzhen, China are utilized as data sources of the case study. The results indicate that our proposed framework can well detect the place characteristics of urban metro stations, which enriches the place-based GIS research and provides a human-centric perspective for urban planning and location-based-service (LBS) applications.

Implications for urban planning

As Kevin Lynch stated in The Image of the City (Lynch, 1960), the skeleton of individuals’ mental images is formed by five types of elements in the city: paths, edges, nodes, districts and landmarks, which mediates in the interaction between humans and their environment. The first thing we want to emphasize in this study is that urban metro stations are also one type of such cognitive elements (i.e., landmarks) in cities; their properties as cognitive places should be considered in urban planning and design so as to match people’s cognition. In addition, our extracted cognitive regions of urban metro stations show diverse and irregular shapes, which indicates that unified physical distances frequently used in existing studies and planning practices cannot precisely define TOD precincts perceived by humans. To this end, what we suggest in this study is that urban planning practices should attach importance to “cognitive place” and “cognitive distance”, which load human experiences and perceptions toward the environments (Briggs, 1973; Montello, 1991). This is also coincident with the ultimate goal of urban planning, urban design, and smart-city construction, i.e., making better human societies and improving human lives (Shaw & Sui, 2019).

Understanding neighborhood isolation through spatial interaction network analysis using location big data

Research article published at the journal of Environment and Planning A: Economy and Space on December 1, 2019

Timothy Prestby, Joseph App, Yuhao Kang, Song Gao. (2019) Understanding Neighborhood Isolation through Spatial Interaction Network Analysis using Location Big Data. Environment and Planning A: Economy and Space. DOI: 10.1177/0308518X19891911

Download link: https://journals.sagepub.com/doi/full/10.1177/0308518X19891911

Abstract

Hidden biases of racial and socioeconomic preferences shape residential neighborhoods throughout the USA. Thereby, these preferences shape neighborhoods composed predominantly of a particular race or income class. However, the assessment of spatial extent and the degree of isolation outside the residential neighborhoods at large scale is challenging, which requires further investigation to understand and identify the magnitude and underlying geospatial processes. With the ubiquitous availability of location-based services, large-scale individual-level location data have been widely collected using numerous mobile phone applications and enable the study of neighborhood isolation at large scale. In this research, we analyze large-scale anonymized smartphone users’ mobility data in Milwaukee, Wisconsin, to understand neighborhood-to-neighborhood spatial interaction patterns of different racial classes. Several isolated neighborhoods are successfully identified through the mobility-based spatial interaction network analysis.

Keywords: Neighborhood isolation, human mobility, big data, spatial interaction

a dark background version of the neighborhood isolation map without a cartogram in Milwaukee, Wisconsin
Spatial interactions between Milwaukee communities and their demographic composition. The brighter flows are places where more flows are overlapping/converging together.
The community flows are overlaid on top of a cartogram distorted by the percent of the non-white population of the census block groups to promote a more socially just map.

Acknowledgments

The authors would like to thank Safegraph, Inc., for providing the anonymous mobile phone location big data support. T.P. and S.G. thank the UW-Madison Hilldale Undergraduate/Faculty Research Fellowship for their support for this research.

Call for papers: GIScience 2020 International Conference

11th International Conference on Geographic Information Science (GIScience 2020)

http://www.giscience.org

Poznań, Poland, 15-18 September, 2020

The 11th International Conference on Geographic Information Science will be held in Poznań, Poland, 15-18 September 2020. Hosted by Adam Mickiewicz University, GIScience 2020 continues the long tradition of the series as a flagship conference for researchers in geographic information science and related disciplines that are interested in spatial and temporal information.

The biennial conference series typically attracts over 300 international participants from academia, industry, and government to advance the state-of-the-art in geographic information science. The first conference day (September 15, 2020) will be dedicated to workshops and tutorials, while the main conference will be taking place on September 16-18, 2020. The conference offers two separate paper tracks, one for full papers and the other for short papers, both of which will undergo full peer-review. Authors of accepted papers will be given the opportunity to present their work at the conference in an oral presentation or as a poster.

The GIScience conference series is deeply interdisciplinary with contributions frequently involving domains such as geography, earth science, cognitive science, information science, computer science, linguistics, mathematics, philosophy, life sciences, and social science. It attracts contributions from experts in geo-visualization, geographic information retrieval, geostatistics, geo-semantics, geosimulation, spatial optimization, transportation, computational geometry, and data structures. Topics of interest are not restricted to the geo-spatial realm but involve spatial and temporal information more broadly.

Since 2018, GIScience proceedings are published in LIPIcs, the Leibniz International Proceedings in Informatics series (https://www.dagstuhl.de/en/publications/lipics). LIPIcs volumes are peer-reviewed and published according to the principle of open access, i.e., they are available online and free of charge. Each article is published under a Creative Commons CC BY license (http://creativecommons.org/licenses/by/3.0/), where the authors retain their copyright. Also, each article is assigned a DOI and a URN. The digital archiving of each volume is done in cooperation with the Deutsche Nationalbibliothek/German National Library. A number of other high-standing international conferences have already made the move to LIPIcs.

CONFERENCE TOPICS

Contributions are invited from a wide range of disciplines related to geographic information science, such as geography, earth science, cognitive science, information science, computer science, linguistics, mathematics, philosophy, life sciences, and social science. Topics of interest include (but are not limited to):

  • Agent-based modeling
  • Computational geometry
  • Events and processes
  • GeoAI
  • Geo-APIs
  • Geo-knowledge graphs
  • Geo-semantics
  • Geographic information observatories
  • Geographic information retrieval
  • Geosimulation and spatio-temporal modelling
  • Geovisualization and visual analytics
  • High-performance computing algorithms for spatial-temporal data
  • Human-Computer Interaction (with mobile devices)
  • Image classification methods
  • Internet of Things
  • Location privacy
  • Location-Based Services
  • Navigation
  • Replicability and reproducibility in GIScience
  • Scene recognition
  • Sensitivity analysis for spatial-temporal models
  • Spatial and spatio-temporal statistics
  • Spatial and temporal language
  • Spatial aspects of social computing
  • Spatial data infrastructures
  • Spatial data structures and algorithms
  • Spatially-explicit decision support
  • Spatially-explicit machine learning
  • Standardization and interoperability
  • Time series analysis
  • Trajectory and movement analysis
  • Uncertainty quantification and error propagation
  • Virtual reality


INFORMATION FOR AUTHORS

Full Paper Track

Full research papers will be thoroughly reviewed by at least three members of the international program committee. For this edition of the GIScience series, we will include an optional rebuttal phase during which authors can respond to the (initial) reviews. The rebuttal phase provides an opportunity to address misunderstandings, answer questions, or provide further details on issues that remained unclear to the reviewers. The reviewers will be able to react to these rebuttals by adjusting their review scores, if appropriate. Review criteria include novelty, significance of results as compared to previous work, the quality of the presented evaluations (if applicable), the clarity of the research statement, as well as the quality of writing and supporting illustrations. High-quality submissions will be accepted for presentation at the conference and published in LIPIcs, the Leibniz International Proceedings in Informatics series. Manuscripts must describe original work that has neither been published before, nor is currently under review elsewhere. Papers must be written in English and should not exceed fifteen pages (including title, figures, and references) in the required layout (see below). 

Short Paper Track

Short papers can report on the latest breaking results, present visions for the future of the field, or describe early work and experiments, as well as novel application areas. Short papers will also be reviewed by at least three reviewers. Review criteria include novelty, expected impact of early results, evaluation or evaluation plans for the future, plausibility of presented visions, as well as the quality of writing and supporting illustrations. Accepted papers in this track will be selected for either oral or poster presentations. Short papers must be written in English and should not exceed six pages (including title, figures, and references) in the requested LIPIcs layout. In addition, each submission must include Short Paper as a subtitle. 

The submission Web page for both tracks of GIScience 2020 is: https://easychair.org/conferences/?conf=giscience2020.


IMPORTANT DATES 

  • FULL PAPER TRACK
    • Full paper submissions: March 16, 2020
    • Full paper rebuttal phase: April 24-30, 2020
    • Full paper notification: May 15, 2020
    • Camera-ready papers: June 1, 2020
    • Full paper author registration deadline: June 1, 2020
       
  • SHORT PAPER TRACK
    • Short paper submission: May 25, 2020
    • Short paper notification: July 3, 2020
    • Camera-ready papers: July 15, 2020
    • Short paper author registration deadline: July 15, 2020
FORMATTING INSTRUCTIONS (all tracks)

The layout of any PDF submission to GIScience, whether full paper or short paper, should follow the 2019 template provided by LIPIcs (http://drops.dagstuhl.de/styles/lipics-v2019/lipics-v2019-authors.tgz). LIPIcs also provides a LaTeX class and template for papers. Authors unfamiliar with LaTeX, but keen to try, are highly encouraged to use Overleaf (http://www.overleaf.com), an online LaTeX editor that is easy to use and does not require any local installation. Overleaf comes with the LIPIcs class and template pre-loaded. Authors who want to use other word processors or text editors should stay close to the sample article’s layout for their paper submitted for review. Should their papers be accepted for publication, they will have to be converted to LaTeX using the LIPIcs LaTeX class and template. Authors are responsible for the conversion of their papers to LaTeX. There are also commercial conversion services such as http://wordtolatex.com/upload providing a one-step solution in case you do not want to do the conversion yourself. 

Dynamic Estimation of Individual Exposure Levels to Air Pollution Using Mobile Phone Data

Mingxiao Li, Song Gao, Feng Lu, Huang Tong, Hengcai Zhang. (2019) Dynamic Estimation of Individual Exposure Levels to Air Pollution Using Trajectories Reconstructed from Mobile Phone Data. International Journal of Environmental Research and Public Health. 16(22), 4522. DOI: 10.3390/ijerph16224522

Abstract: The spatiotemporal variability in air pollutant concentrations raises challenges in linking air pollution exposure to individual health outcomes. Thus, understanding the spatiotemporal patterns of human mobility plays an important role in air pollution epidemiology and health studies. With the advantages of massive users, wide spatial coverage and passive acquisition capability, mobile phone data have become an emerging data source for compiling exposure estimates. However, compared with air pollution monitoring data, the temporal granularity of mobile phone data is not high enough, which limits the performance of individual exposure estimation. To mitigate this problem, we present a novel method of estimating dynamic individual air pollution exposure levels using trajectories reconstructed from mobile phone data. Using the city of Shanghai as a case study, we compared three different types of exposure estimates using (1) reconstructed mobile phone trajectories, (2) recorded mobile phone trajectories, and (3) residential locations. The results demonstrate the necessity of trajectory reconstruction in exposure and health risk assessment. Additionally, we measure the potential health effects of air pollution from both individual and geographical perspectives. This helped reveal the temporal variations in individual exposures and the spatial distribution of residential areas with high exposure levels. The proposed method allows us to perform large-area and long-term exposure estimations for a large number of residents at a high spatiotemporal resolution, which helps support policy-driven environmental actions and reduce potential health risks.

GeoDS Lab at the Emerging Technology Leadership Summit 2019

Hyper Innovation is working with the Wisconsin Institutes for Discovery to establish the Emerging Tech Hub@UW-Madison to highlight applications for emerging technologies (e.g., VR/AR), create inspiration for innovation, and provide collaboration opportunities for startups, universities, and corporations.

GeoDS Lab among other campus teams were invited to show the Augmented Reality Beacons demo at the Innovation and Emerging Technology Leadership Summit – November 14, 2019.

VR Playground
AR SandBox

GeoDS Lab at ACM SIGSPATIAL’19

During November 5 – 8, 2019, GeoDS lab members presented at the 27th ACM SIGSPATIAL International Conference on Advances in Geographic Information Systems (ACM SIGSPATIAL 2019) held in Chicago. We had two presentations and got one “Best Poster Award” in the Workshop on Ride-hailing Algorithms, Applications, and Systems (RAAS 2019)

  1. Analyzing the Gap Between Ride-hailing Location and Pick-up Location with Geographical Contexts (Best Poster Award). Yunlei Liang, Song Gao, Mingxiao Li, Yuhao Kang, and Jinmeng Rao (2019). In Proceedings of 1st ACM SIGSPATIAL International Workshop on Ride-hailing Algorithms, Applications, and Systems (RAAS’19) DOI: 10.1145/3357140.3365493 [PDF]
  2. A Data-Driven Approach to Understanding and Predicting the Spatiotemporal Availability of Street Parking (Short Paper). Mingxiao Li, Song Gao, Yunlei Liang, Joseph Marks, Yuhao Kang, and Moyin Li (2019). In Proceedings of 27th ACM SIGSPATIAL International Conference on Advances in Geographic Information Systems(SIGSPATIAL’19) DOI: 10.1145/3347146.3359366 [PDF]

As the General Chairs, Professor Song Gao co-organized the 3rd ACM SIGSPATIAL International Workshop on AI for Geographic Knowledge Discovery (GeoAI 2019). There are two keynotes from both industry and academia and 17 oral presentations in the GeoAI workshop. The proceedings of the GeoAI’19 workshop is available at the ACM Digital Library (Table of Contents): https://dl.acm.org/citation.cfm?id=3356471

GeoAI’19
SIGSPATIAL’19